ARA Oil Product Stocks Rise (week 48 – 2020)

November 26, 2020 — Total oil products held in independent storage in the Amsterdam-Rotterdam-Antwerp (ARA) trading hub rose on the week, supported by builds in gasoil and fuel oil, according to data from consultancy Insights Global.

Gasoil inventories rose as a result of high inflows and the sixth consecutive week on week fall in gasoil flows from the ARA area to inland destinations along the river Rhine.

Consumption in the northwest European hinterland is under heavy pressure from Covid-19 restrictions, and inventories at inland terminals are also high.

Tankers arrived in the ARA area from Saudi Arabia and Russia, and the volume departing for the US fell on the week. Fuel oil stocks rose on the week to reach five-week highs. Cargoes arrived from the Caribbean, Denmark, Latvia, Russia and the UK. A single tanker departed for Saudi Arabia and several small vessels left for the
Mediterranean carrying bunker fuel cargoes.

Stocks of all other surveyed products fell. Gasoline stocks were lower, with a rise in outflows to west Africa. Dwindling interest from the well-supplied US Atlantic coast market reduced westbound transatlantic flows.

Low demand within Europe continued to weigh heavily on blending activity, keeping the quantity of gasoline blending components moving around the ARA area on barges low.

Naphtha stocks fell heavily, reaching four-week lows. Some limited demand emerged from northwest European gasoline blenders, but the petrochemical sector continued to absorb the lion’s share of available naphtha cargoes. Small cargoes arrived in the ARA area from Norway, Portugal, the UK and Russia.

Jet fuel stocks fell for a third consecutive week to reach seven-week lows, with low inflows. And regional output is being constrained by a combination of refinery run cuts, economic shutdowns, maintenance work and refiners choosing to maximise gasoil production.

Reporter: Thomas Warner

ARA Oil Products Stocks Fall Despite Gasoline Build (Week 47 – 2020)

November 19, 2020 — Total oil products held in independent storage in the Amsterdam-Rotterdam-Antwerp (ARA) trading hub fell on the week,
as a rise in gasoline and naphtha stocks was outweighed by falls in all other products, according to data from consultancy Insights Global.

Gasoline stocks rose to reach six-week highs as a result of dwindling demand from key export market the US Atlantic Coast.

Implied US gasoline demand fell to a four-month low in the week to 13 November, according to the latest EIA data.

The lack of demand pushed stocks to a seven-week high in the world’s largest gasoline consuming country and key export destination for European producers.

Tankers departed the ARA area for the US, but the total volume was eclipsed by the amount departing for west Africa and the Mediterranean.

Low demand in Europe and from export markets continued to weigh heavily on blending activity, reducing the quantity of gasoline blending components moving around the ARA area on barges despite barge freight costs on intra-ARA routes being at record lows.

Naphtha was the only other surveyed product to rise, with stocks increasing on the week to reach six-week highs. The lack of gasoline blending reduced local demand for naphtha as a blending component.

Demand from petrochemical end-users inland was marginally lower on the week, but is expected to stay robust throughout the winter owing to relatively high prices of rival feedstocks. The arrival of several cargoes from Russia and an LR2 from Algeria buoyed inventories further.

Gasoil inventories fell by almost 8pc to reach their lowest since the week to 30 April. Several cargoes departed for the US Atlantic coast as part of an unusual reverse arbitrage route that first emerged in October.

Tankers also departed for the UK and west Africa. Demand from along the River Rhine was low owing to high inventories inland.

Jet fuel stocks fell for a second consecutive week to five-week lows, but remained close to all-time record highs.

Tankers departed for the UK and Ireland while none arrived. Fuel oil stocks fell on the week to reach five-week lows. High sulphur cargoes departed for the Mideast Gulf and west Africa, while IMO-compliant very low sulphur fuel oil left the ARA area on intra-European routes. Cargoes arrived from the Caribbean, Finland and Russia.

Reporter: Thomas Warner

ARA Oil Products Stocks Rise (Week 45 – 2020)

November 5, 2020 — Oil products held in independent storage in the Amsterdam-Rotterdam-Antwerp (ARA) trading hub edged up over the past week after hitting eight-week lows a week earlier.

Stocks rose in the week to 4 November, supported by rises in gasoil, naphtha and jet fuel inventories, according to data from consultancy Insights Global.

Jet fuel stocks rose to fresh all-time highs for the third consecutive week, amid persistently low demand from the commercial aviation sector.

The reintroduction of Covid-19 restrictions across large parts of Europe has put fresh pressure on the demand outlook for jet fuel.

Jet fuel cargoes arrived in the ARA area from Singapore and the UAE over the past week, more than offsetting shipments departing for Ireland and the UK.

Gasoil stocks rose on the week despite several cargoes departing for the US and Canada in a rare reversal of the usual arbitrage route.

Tankers carrying gasoil also departed ARA for destinations elsewhere in northwest Europe, while gasoil arrived from Russia and Saudi Arabia.

Gasoil demand from the European hinterland was steady on the week, but high inventories at depots along the river Rhine appear likely to curtail barge flows as November progresses.

Naphtha stocks rose, boosted by cargoes arriving from Algeria, Russia and the UK. Only one tanker carrying naphtha departed ARA.

Trading firm Vitol booked the Captain Spiro to carry cargo from Rotterdam to Brazil, where it will be used as a petrochemical feedstock.

Demand for naphtha from petrochemical plants within northwest Europe was supported over the past week by high prices of rival feedstocks.

The volume of naphtha heading up the river Rhine on barges rose on the week as a result.

Gasoline inventories fell, drained by cargoes departing ARA for east and west Africa, as well as the Mediterranean, Canada and the Caribbean.

No gasoline tankers departed on the typical trade route to the US, where inventories rose in every region except the west coast last week.

Delays in the blending component barge market around Amsterdam dissipated after some congestion developed during the previous week.

Fuel oil stocks fell on the week, with exports picking up in a quiet market. Tankers carrying fuel oil arrived in ARA from Denmark, France,

Russia and Sweden and departed for the Mideast Gulf, the Mediterranean and west Africa.

Reporter: Thomas Warner

ARA Oil Products Stocks Rise (week 43 – 2020)

October 22, 2020 — Oil products held in independent storage in the Amsterdam-Rotterdam-Antwerp (ARA) trading hub rose over the past week, buoyed by a sharp rise in fuel oil stocks, according to data from consultancy Insights Global.

Overall oil product stocks rose in the week to 22 October, but the different products fared very differently. Fuel oil stocks rose on the week, the highest level since mid-July.

Market participants may be drawing cargoes together in the ARA area to send them on the arbitrage route to Singapore.

An Aframax departed for Port Said for orders, where it will either find a home in the eastern Mediterranean or travel onward to the Mideast Gulf or Singapore.

The rise in inventories was the result of cargoes arriving from the Caribbean, where a poor cruise ship season has reduced bunker fuel demand, as well as low sulphur cargoes from Germany and the US. At least one Aframax arrived from the Russian Baltic.

Gasoline inventories rose, against a backdrop of fading demand. Outflows to key export regions the US and west Africa fell on the week, and the traffic in gasoline blending components slowed. Congestion in the blending component barge market had caused loading delays as recently as the beginning of October, but there was little sign of any congestion this week as demand dwindled locally and elsewhere. Tankers arrived in the region from France, Italy, Russia and the UK.

Some gasoil barge loadings were delayed, with inland inventories high enough to prompt some market participants to delay loading barges to take middle distillates inland.

Gasoil inventories fell, and a rare fixture emerged to take European diesel to the US where the New York Harbour area is providing an outlet for the oversupplied European market.

Naphtha inventories fell to reach their lowest since March. An MR tanker departed the ARA area for Brazil, where the naphtha will be used as a petrochemical feedstock.

And it was firm demand from petrochemical end-users in northwest Europe that caused the stockdraw during the week. High prices of rival feedstocks made naphtha relatively attractive to ethylene producers, and the volume leaving the ARA for inland destinations on barges rose on the week.

Jet fuel stocks rose to reach fresh all-time highs, against a backdrop of poor demand. German airline group Lufthansa has warned of a bleak demand outlook during the winter because of Covid-19 related travel restrictions. Two tankers that had been serving as floating storage on the North Sea discharged in the ARA area, and small cargoes departed for the UK and Ireland.

Reporter: Thomas Warner

Is hydrogen the liquid bulk growth market of the future?

As governments worldwide are looking for ways to reduce their carbon footprint, hydrogen is often considered as an indispensable element in the energy transition. The importance of fossil fuels as the primary energy source for the global economy is expected to dwindle in the coming decades. Is hydrogen the perfect candidate to take their place?

As governments worldwide are looking for ways to reduce their carbon footprint, hydrogen is often considered an indispensable element in the energy transition. The importance of fossil fuels as the primary energy source for the global economy is expected to dwindle in the coming decades. Is hydrogen the perfect candidate to become the liquid bulk of the future?

As renewable energy is getting cheaper to produce thanks to advances in solar panel and wind turbine development, the ‘missing links’ in the transition to renewables are energy distribution and storage. While solar and wind can, in theory, easily meet all our energy needs, it’s not always sunny or windy outside – without a suitable energy carrier, matching supply and demand is practically impossible.

Hype or hope?

On paper, hydrogen is very well suited as an energy carrier. It’s not only the most abundant element in our universe but is also easy to combust, can be electrolyzed from water, and does not produce any harmful waste when combusted. Furthermore, compared to batteries, the energy density (MJ/kg) of hydrogen is much higher, meaning it can produce more power with less weight.

It’s therefore hardly surprising that many industries see hydrogen as an important growth market for the future. Mostly oil and chemical companies, which have a lot of the required infrastructure for distributing and converting gas and liquids already in place, consider hydrogen as an integral part of their future.

Does that mean hydrogen is the growth market of the future, replacing fossil fuels like diesel, gasoline, and kerosene? Well, it depends.

Over the past few decades, hydrogen-powered electric propulsion promised to be the perfect replacement for fossil fuel combustion engines in cars and trucks. Since both the car industry and fuel industry had ample experience with gas and liquid fuels, switching from petrol and diesel to hydrogen seemed relatively straightforward. However, over the past few years, considerable developments in lithium battery technology have upended this belief drastically.

If we look at the so-called ‘well-to-wheel’ efficiency, the difference between hydrogen-powered and battery-powered vehicles is quite dramatic. While ‘tank-to-wheel’ efficiency tells you how efficiently an engine turns fuel into movement (the traditional ‘miles per gallon’ metric), ‘well-to-wheel’ efficiency adds the energy it took to get that fuel to the gas tank or battery. Whereas the ‘well-to-wheel’ efficiency of hydrogen-powered is significantly better than the ‘well-to-wheel’ efficiency of a petrol fuel car (22% vs. 13%), battery-powered vehicles on average have a ‘well-to-wheel’ efficiency of 73%.

The main reason for this difference in efficiency is the required extra steps to convert electricity into forward motion. Hydrogen first needs to be produced through electrolysis at a production plant, only to be converted back into electricity in the car to power the electric motor.

Storing and distributing hydrogen also comes with a set of challenges. Storage of hydrogen as a gas typically requires high-pressure tanks (350–700 bar or 5,000–10,000 psi tank pressure). Hydrogen can also be stored as a liquid, but considering the boiling point of hydrogen at one-atmosphere pressure is −252.8°C, this requires cryogenic temperatures. In short, this means that both storing hydrogen as a gas or a liquid requires large amounts of energy, as the hydrogen needs to be pressurized or cooled, respectively. 

A promise unfulfilled?

Does this mean hydrogen has no place in our ongoing energy transition? No, not at all. While hydrogen might not be as suited as fuel for cars as it once was thought, it still has a lot of potential as an energy carrier in industrial applications. 

Over the past years, the proportion of renewable energies has proliferated. Wind power and solar energy have seen the most significant increase. However, because the wind doesn’t always blow, and the sun doesn’t always shine, the availability of these so-called variable renewable energies (VREs) fluctuates over time. Simultaneously, because of how power grids work, supplying electricity requires a constant balancing of supply and demand.

As the proportion of renewable energies keeps growing, additional measures are necessary to integrate fluctuating renewable energy supplies. Because of its relatively straightforward production and abundance, hydrogen is very suitable to store energy production peaks from solar and wind, thus balancing energy supply and demand.

Bulk storage

Balancing the energy production of variable renewable energies will require large amounts of hydrogen storage capacity. Can we leverage our current liquid bulk storage capacity for this herculean task? The most important hydrogen storage methods are physical storage methods based on either compression or cooling or a combination of the two (hybrid storage). As mentioned before, hydrogen is typically stored in high-pressure tanks. Higher storage density comes at a price, however. The higher the storage density, the greater the amount of energy needed for cooling and compression, and the more complex the design of tank systems and infrastructure. Because of the extreme high pressures, converting current liquid bulk storage assets will most likely not be feasible.

In addition to physical storage methods, a large number of other new, material-based hydrogen storage technologies are being developed. These materials-based storage technologies can include solids, liquids, or surfaces. While most of these techniques are still in their infancy, materials-based storage technologies promise to solve many of our current issues with hydrogen storage. For tank terminals, liquid organic hydrogen carriers (LOHCs) represent an especially interesting option. By binding hydrogen chemically in organic compounds like, for instance, methanol and ammonia, these liquids act as a chemical battery for storing hydrogen molecules.

Stay up-to-date on hydrogen storage as a growth market

As liquid bulk terminals are specifically designed for handling such liquid organic compounds, the tank terminal industry will keep a keen eye on these storage technologies.

The developments in the ongoing energy transition and its impact on the fuel market make it crystal clear that hydrogen should be on the radar for every tank terminal operator. During our regular Market Update webinars, we offer our expert outlook on short-term supply, demand, and trade flows and look ahead to future developments and new technologies.



Impact of OPEC+ conflict and COVID-19 on Tank Storage Demand in Main Oil Hubs (part 3)

Recap second quarter 2020

FROM THE TANKER VISITS AND MARINEGROSS TRADE OF TERMINALS WITH WATER ACCESS, IT WAS CONCLUDED THAT, DUE THE COVID-19 PANDEMIC, DEMAND FOR FUELS HAD BEEN SEVERELY WEAKENED. THIS RESULTED IN LESS PRODUCT BEING MOVED TO AND FROM TERMINALS, AND THE TREND THAT WAS ALREADY VISIBLE IN THE FIRST QUARTER OF 2020 EVEN ACCELERATED IN THE SECOND QUARTER OF 2020. INTELLIGENT LOCKDOWNS, CLOSED BORDERS AND OTHER PREVENTIVE MEASURES IN ALL MAJOR HUBS WEIGHED ON FUEL CONSUMPTION AND INTERNATIONAL TRADE FLOWS.

THE COVID-19 PANDEMIC AND THE SHORT-TERM SUPER CONTANGO HAD A HUGE IMPACT ON FUEL DEMAND, TRADE FLOWS AND STORAGE DEMAND, COINCIDING FOR ALL TRADING HUBS. STATISTICS SHOWED THE VIRUS WAS LONG FROM DEFEATED AND IF COUNTRIES DID NOT TAKE IMMEDIATE PREVENTIVE ACTIONS A SECOND WAVE WAS EXPECTED TOWARDS THE END OF THE YEAR. THIS WOULD MEAN THAT CURRENT MARKET DYNAMICS WILL PERSIST FOR THIS YEAR.

Key highlights third quarter

  • Tanker visits in the third quarter dropped to their lowest value in three years but the decrease was less than in prior quarter
  • Like the number tanker visits, marine gross trade volumes in the third quarter also fell to their lowest value in three years. Again, the rate of decline was not as strong as in 2Q20
  • Berth occupancy rates in the third quarter showed a modest uptick
  • Total stocks in the hubs are declining in the third quarter with tanker visits are gradually increasing in the last part of 3Q20

Tanker Visits Per Hub Per Quarter

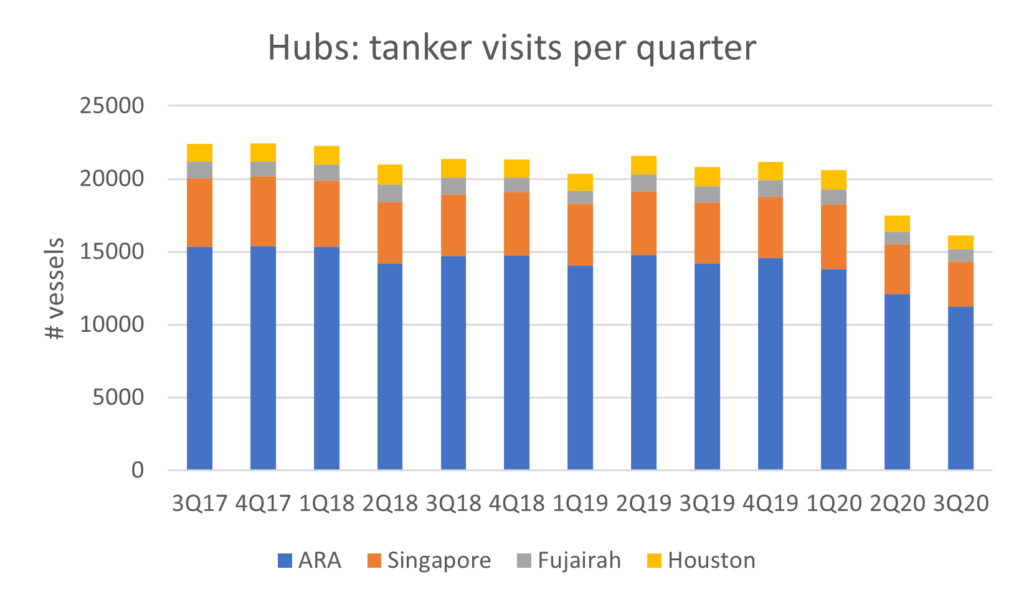
Looking at all oil tanker visits per hub combined in the graph below, we see that the total number has fallen from the second quarter to third quarter with 8% to 16,126 tanker visits. Comparing the third quarter of this year with the third quarter last year, there is even a 22% decline visible. With the exception of Fujairah, which showed its second lowest value, all hubs in the third quarter showed their lowest value in three years. In the ARA, the number of tanker visits fell from 12,124 to 11,254 which is a 7% decline q-o-q. Comparing y-o-y, tanker visits in Europe’s main hub decreased by 21%. In the Asian hub, Singapore, the number of tanker visits fell from 3,393 to 3,072. That is a 27% decline y-o-y and a 9% decline q-o-q. Houston showed, with 937 tanker visits, the largest drop, q-o-q with 15% and y-o-y with 29%. As stated before, Fujairah, with 863 tanker visits, showed its second lowest value in the third quarter. On a quarterly basis, tanker visits rose by 1% while on yearly basis, tanker visits dropped with 22%. Looking at the consolidated numbers of the hubs, we see that pace of decline is slowing. From 1Q20 to 2Q20, the number of ship visits fell from 20,586 to 17,474 or 15% while from 2Q20 to 3Q20, we saw a 8% decline. The slower pace of decline is mostly the result that as from mid-August the number of oil tanker visits started to improve modestly.

Figure 1: Tanker visits per hub per quarter; source TankTerminals.com

Marine Gross Trade Per Hub Per Quarter

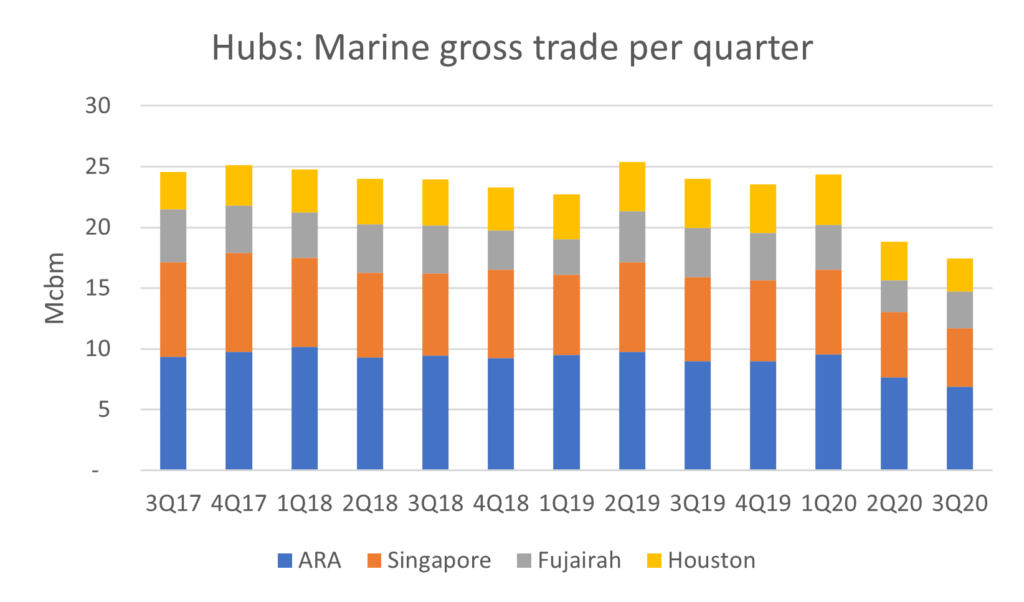
The marine gross trade numbers show a similar pattern in relation to the tanker visits. For all hubs combined the marine gross trade figures dropped from 18.8Mcbm in the second quarter of 2020 to 17.4Mcbm in the third quarter of 2020, reflecting a decline of 7%. On yearly basis, comparing 3Q19 with 3Q20 marine gross trade numbers shaved some 23%. Again the value of 3Q20 was the lowest value in three years’ time and  this applied for all hubs with the exception of Fujairah. In the ARA region, marine gross trade volume edged 10% lower on quarterly base to 6.9Mcbm and 24% lower on a yearly base. In Singapore, marine gross trade volumes decreased by 10% to 4.8Mcbm q-o-q while in Asia the volumes dropped with  30% year-on-year. In Fujairah volumes in the third quarter were 3Mcbm compared to 2.6Mcbm in the second quarter. That is a 14% build q-o-q but on a yearly basis it is still 25% lower. Houston showed the largest drop quarter-on-quarter (14%) and year-on-year (33%). The marine gross trade volume in the third quarter stood at 2.7Mcbm.

Figure 2: Marine gross trade per hub per quarter; source TankTerminals.com

Berth Occupancy Per Hub Per Quarter

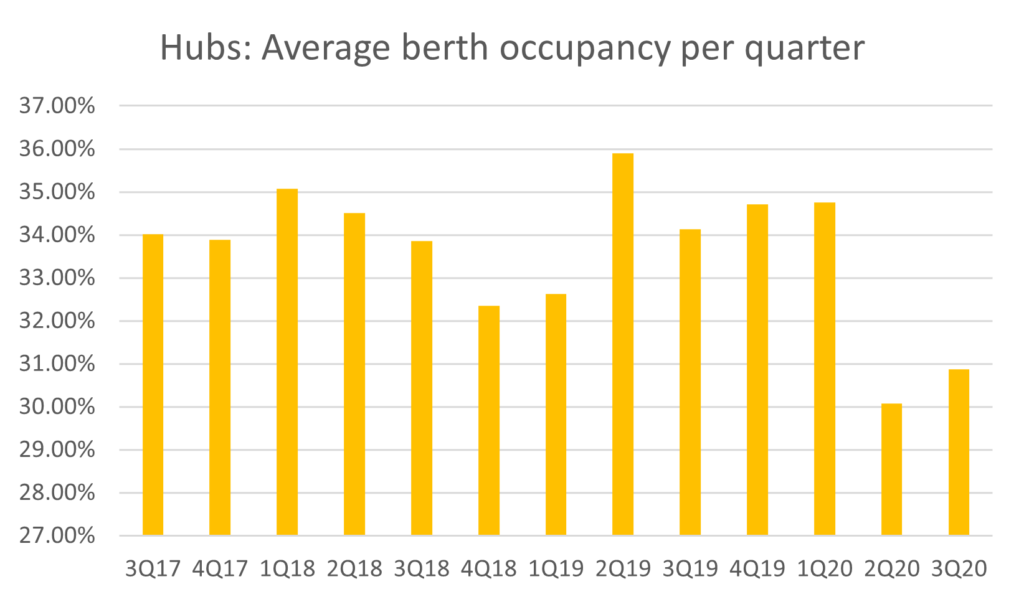
With the exception of Houston, similar patterns were seen for ARA, Singapore and Fujairah when looking at the average berth occupancy of the local marine terminals. The berth occupancies at these hubs still stood at their second lowest value since 2017 but showed a minor uptick compared to the second quarter of this year. The berth occupancy rate for all hubs combined rose from an occupancy of almost 30% to almost 31%. In the ARA region, average berth occupancy rates rose from 31% to almost 31.5% in the third quarter. In Singapore, average berth occupancy rates grew from 29.5% to 30% while in Fujairah, occupancy rates jumped from 29.5% to 32.2%, making it the biggest mover. Berth occupancy rates in Houston fell from 30.3% to 29.7%.

Figure 3: Average berth occupancy per quarter; source TankTerminals.com

Stock numbers versus tanker visits

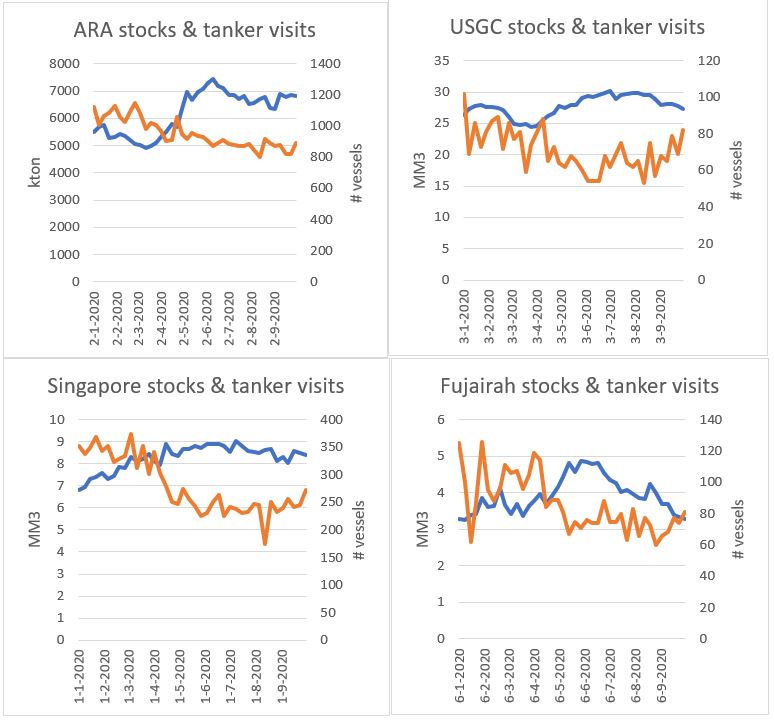
Total stocks combined (including light ends, middle distillates and heavy end stocks) showed similar patterns like the number of tanker visits as already explained. It seems that in most trading hubs total stocks peaked around the middle of the year (June) and then started a modest descent in the third quarter. The rise in stocks was a combination of fuel demand destruction and the presence of the super contango due to the impact of COVID-19. The number of tanker visits shows a contradictive pattern, with the number of visits kind of bottoming out as from the middle of the year.

Figure 4: ARA stock levels and tanker visits; source TankTerminals.com

Conclusion

The number of tanker visits in the third quarter of this year kept decreasing for all primary trading hubs. However, the pace of decline was less strong than in the second quarter. The weaker contraction rate came from a recovery of ship movements in the last four weeks of the quarter. The same pattern was visible for marine gross trade volumes. Average berth occupancy rates for all hubs showed a modest increase. These developments combined with lower stocks indicate that the easing of the COVID-19 lockdown measurements during the summer period have supported trading and shipping dynamics at global trading hubs.

So although fuel demand remained very weak some indications of improvement were visible. Worrying is that in September the numbers of Corona infectious globally started to rise again. This situation led most countries to undo the relief of restrictive measures. In these countries harsh actions have been introduced to further limit travel movements and social contacts of people. Obviously this will lead to less fuel demand in the transport industry and thus less trading and business activity at the terminals.

It is expected that, with a continuation of the restrictive measures in the world well into December and January, the number of tanker visits and marine gross trade volumes remain depressed. Recovery will go hand in hand with the introduction of a vaccine. However, expectations are that numbers and volumes will still not be on the level as before the Corona pandemic.

About the authors and the data

The data in this report was extracted from the Tankterminals.com database and Insights Global’s weekly ARA Oil Product Levels publication. The data in Tankterminals.com came specifically from the Logistical Performance Benchmarking addon, which uncovers information on certain terminal performance indicators such as occupancy rates and turnaround times at berth level of a terminal. To analyze the hubs, all the berth data from the various terminals located in these specific hubs was aggregated and offered these unique insights. Tankterminals.com has data on the logistical performance dating back till the third quarter of 2017. Insights Global’s weekly ARA Oil Product Levels publication is a well-established report in the international oil trading business. Insights Global has data going back to 1995.

Jacob van den Berge has been working for Insights Global for more than 8 years and has 10 years of experience in the oil & gas industry. Currently he is the Head of Marketing and Sales but used to work as an oil market analyst and industry consultant for the company.

Contact Insights Global if you would like to discuss how our data driven company can add value to your organization by enabling intelligent decisions.

Having access to accurate, up-to-date oil storage rates is crucial to make the right business decisions.

With our Global Oil Storage Rate Report, you’ll gain access to the single and only authoritative source of storage rate information available worldwide. It will provide you with transparency on price levels in global tank storage markets regularly, so you are always in the know and can set the right ask and bid prices for your storage.

Download your FREE Sample Report now and discover what information you could have at your fingertips each quarter.

Norway’s Prime Minister Erna Solberg opens the world’s largest test facility for CO2 transport

Oil & Gas 360 Publishers Note: This is an excellent example from Equinor and Norway on the oil & gas market working to accelerate efforts to capture CO2.

On 30 October Prime Minister Erna Solberg opened the world’s largest CO2 transport test facility at Equinor in Porsgrunn.

The test facility transports CO2 in pipelines, both in gas and liquid form. The objective is to learn more about how CO2 behaves during pipeline transport, which is important knowledge in order to scale up CO2 transport and storage in the future.

The work you do here is an important contribution to the government’s strategy for carbon capture and storage,’ Prime minister Erna Solberg said when she officially opened the test facility.

Equinor has transported CO2 from the Sleipner field in the North Sea since 1996 and from the Snøhvit facility in Hammerfest since 2009, both are projects which have provided Equinor with important information about CO2 transport. In these projects, the CO2 is transported in gas and liquid form, respectively.

Now Equinor and its partners Total, Gassnova and Gassco have modified the facility to make it possible to study transport of CO2 as gas and liquid, simultaneously. This could yield knowledge that is important for determining where a pipeline route could be laid, and which reservoirs could be utilised. Testing and research can improve operation of the CO2 transport and storage project Northern Lights and can also reduce the costs associated with this new industry in the future.

The test facility was built in 1997. It has been used to test the transport of various combinations of oil, gas and water in the same pipeline, so-called multiphase transport. That’s why the facility is called the Multiphase rig. A total of more than one billion Norwegian kroner has been invested in the test facility, including construction and adaptations during the operations period. The facility is the very heart of Equinor’s research centre in Porsgrunn.

The price tag for the modification work was seven million kroner. The test facility has pipes that run in a 200-metre line, and it is the world’s largest test facility for CO2 transport.

‘This shows how infrastructure and competence from the oil and gas industry can be used to accelerate efforts to capture CO2 and store it in reservoir. This is an opportunity to create a new industry in Norway’, says Sophie Hildebrand, Chief Technology Officer in Equinor.

The plan is initially to use the test facility for two different CO2 transport tests, both tests of multiphase transport and testing of measuring instruments. According to the plan, these tests will be under way until the spring of 2021. After that, the test facility will be used to test the transport of both oil, gas and CO2, depending on where the needs are greatest.

Oil & Gas 360º Publisher Note, Editor: Stu Turley, November 30

Top oil trader Vitol says Europe lockdowns mere ‘speed bump’

The world’s largest independent oil trader doubts that new coronavirus lockdowns in Europe will lead to another significant drop in crude prices following last week’s rout.

“This is a speed bump,” Mike Muller, the head of Asia for Vitol Group, said in an interview Sunday with Dubai-based consultant Gulf Intelligence. “We are not going to see a violent reaction in price on Monday.”

Benchmark Brent crude fell 10% in the five days through Friday to $37.46 a barrel, its lowest since May, as daily Covid-19 cases hit a record in the U.S. and nations including France and Germany announced new lockdowns. The U.K. followed suit on Saturday.

While energy demand in Europe is being hit, global oil inventories fell at a rate of around 2 million barrels a day in September and October and that trend will probably continue, according to Muller.

“We are seeing demand destruction unexpectedly from these lockdown measures — hundreds of thousands of barrels-per-day-equivalent for Europe alone,” he said. “But the bigger, overriding picture is still that the world is in a stock-drawing mode.”

Last year, daily oil consumption in Europe totaled 14.9 million barrels, according to data from BP Plc. Demand was 1.5 million barrels a day in France and 2.3 million in Germany.

OPEC+ — an alliance of the Organization of Petroleum Exporting Countries and other producers such as Russia — has helped bolster prices since it agreed to output cuts in April. The group was meant to ease those curbs by 2 million barrels a day in January, but it may be forced into a delay given oil’s renewed weakness.

Bloomberg, Editor: Nadine Daher, November 30

Shell Mulls closure of some oil refineries if it can’t sell them; convent on the list

The Shell oil refinery in Convent is up for sale but could face closure if the company doesn’t find a buyer as it consolidates its refinery portfolio from 14 sites to only six by 2025.

Shell warned local officials several months ago that it was testing the market for the potential sale of the Convent site, located between Baton Rouge and New Orleans, and its associated facilities.

“We’ve had success (with asset sales) in the past in difficult markets. If it’s not possible, we’ll consider closing and shutting down,” Chief Financial Officer Jessica Uhl said during a conference call with analysts and investors.

The company does expect to keep “refinery capacity in the key markets tied to our chemical business,” she said.

Shell plans to consolidate its assets into six energy and chemical parks, which includes the Norco site near New Orleans. Other sites are in Deer Park, Texas; The Netherlands; Singapore; Germany; and Canada. The new petrochemical parks are expected to be located near existing complexes, such as Shell’s Geismar site in Ascension Parish.

The goal is for the refineries to be more integrated with the chemical complexes and produce more biofuels, hydrogen and synthetic fuels, executives told investors.

Other refineries under review for potential sale or closure include Puget Sound, Washington, and Mobile, Alabama, along with ones in Canada and Denmark.

The Convent refinery sits on 4,400 acres that straddles Ascension and St. James parishes and can process 240,000 barrels of crude oil per day. It employs 700 Shell workers and 400 contract workers. The processing equipment connected to the plant is located in St. James Parish and occupies about 900 acres.

Shell’s subsidiary, Equilon Enterprises LLC, has $1.18 billion in total taxable value in St. James Parish and paid $18.8 million for the refinery in 2019, tax assessor records show.

The refinery produces various grades of gasoline; jet fuel; diesel fuel and heating oil; propane and butane for residential and industrial use; and oil for tankers, power generation and vehicles.

The facility has access to multiple major crude oil and product pipelines, which ship gasoline, diesel, kerosene and jet fuel. The site’s location on the Mississippi River allows shipping and receiving petroleum products aboard ocean-going vessels. The refinery uses two docks along 6,000 feet of Mississippi River access.

The Convent refinery began operations in 1967 as a Texaco refinery. In 1998, a joint venture was formed between Texaco, Saudi Refining and Shell Oil Co. under the name Motiva. In 2001, Texaco was purchased by Chevron and its interest in Motiva was sold to Shell Oil and Saudi Refining Inc. in 2002. A separation of the joint venture between Royal Dutch Shell and Saudi Aramco in 2017 resulted in the Convent refinery being fully owned and operated by Royal Dutch Shell.

The Advocate, Editor: Kristen Mosbrucker, November 30