LONDON (Reuters) – Royal Dutch Shell is looking to slash up to 40% off the cost of producing oil and gas in a major drive to save cash so it can overhaul its business and focus more on renewable energy and power markets, sources told Reuters.
Shell’s new cost-cutting review, known internally as Project Reshape and expected to be completed this year, will affect its three main divisions and any savings will come on top of a $4 billion target set in the wake of the COVID-19 crisis.
Reducing costs is vital for Shell’s plans to move into the power sector and renewables where margins are relatively low. Competition is also likely to intensify with utilities and rival oil firms including BP and Total all battling for market share as economies around the world go green.
“We had a great model but is it right for the future? There will be differences, this is not just about structure but culture and about the type of company we want to be,” said a senior Shell source, who declined to be named.
Last year, Shell’s overall operating costs came to $38 billion and capital spending totalled $24 billion.
Shell is exploring ways to reduce spending on oil and gas production, its largest division known as upstream, by 30% to 40% through cuts in operating costs and capital spending on new projects, two sources involved with the review told Reuters.
Shell now wants to focus its oil and gas production on a few key hubs, including the Gulf of Mexico, Nigeria and the North Sea, the sources said.
The company’s integrated gas division, which runs Shell’s liquefied natural gas (LNG) operations as well as some gas production, is also looking at deep cuts, the sources said.
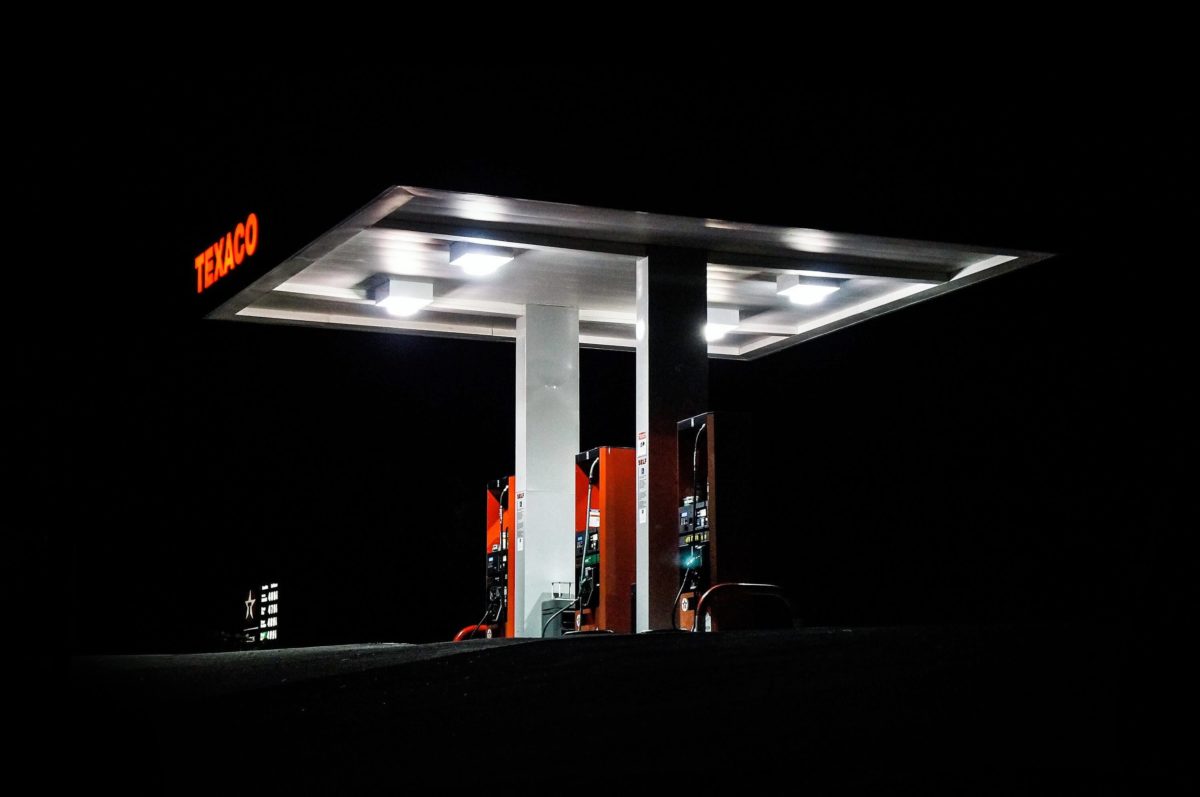
For downstream, the review is focusing on cutting costs from Shell’s network of 45,000 service stations – the world’s biggest – which is seen as one its “most high-value activities” and is expected to play a pivotal role in the transition, two more sources involved with the review told Reuters.
“We are undergoing a strategic review of the organisation, which intends to ensure we are set up to thrive throughout the energy transition and be a simpler organisation, which is also cost competitive. We are looking at a range of options and scenarios at this time, which are being carefully evaluated,” a spokeswoman for Shell said in a statement.
Shell’s restructuring drive mirrors moves in recent months by European rivals BP and Eni which both plan to reduce their focus on oil and gas in the coming decade and build new low-carbon businesses.
The review, which company sources say is the largest in Shell’s modern history, is expected to be completed by the end of 2020 when Shell wants to announce a major restructuring. It will hold an investor day in February 2021.
Speaking to analysts on July 30, Shell Chief Executive Ben van Beurden said Shell had launched a programme to “redesign” the Anglo-Dutch company.
LOW-CARBON FUELS
Teams in Shell’s three main divisions are also studying how to reshape the business by cutting thousands of jobs and removing management layers both to save money and create a nimbler company as it prepares to restructure, the sources said.
Shell, which had 83,000 employees at the end of 2019, carried out a major cost-cutting drive after its $54 billion acquisition of BG Group 2016, which has helped boost its cash generation significantly in recent years.
Shell’s operating costs, which include production, manufacturing, sales, distribution, administration and research and development expenses, fell by 15%, or roughly $7 billion, between 2014 and 2017.
But the sharp global economic slowdown in the wake of the COVID-19 epidemic coupled with Shell’s plans to slash its carbon emissions to net zero by 2050 have led to the new push.
Shell cut its 2020 capital expenditure plans by $5 billion to $20 billion in the wake of the collapse in oil and gas prices due to the pandemic amid warnings it could have lasting effects on global energy demand.
Van Beurden said in July that Shell was on track to deliver $3 billion to $4 billion in cost savings by the end of March 2021, including through job cuts and suspending bonuses.
He said travel restrictions during the pandemic had accelerated the digitalisation of Shell while machine learning was being rolled out to minimise outages and shorten maintenance time at refineries, oil and gas platforms and LNG plants.
Besides cutting costs at its downstream retail business, Shell is pressing ahead with plans to reduce the number of its oil refineries to 10 from 17 last year. It has already agreed to sell three.
The review of refining operations also includes finding ways to sharply increase the production of low-carbon fuels such biofuels, chemicals and lubricants. That could be done by using low-carbon raw materials such as cooking oil, one source said.
Reuters, Ron Bousso, September 21


