Tank Storage Tanks will be full within months

Oil storage tanks will fill up quickly. Due to the corona crisis, planes and cars remain unused. Meanwhile, due to a conflict between Russia and Saudi Arabia, additional oil is poured into the market. Storage tanks are expected to be full within a few months. What happens then?

It is unprecedented how much demand for oil has decreased because of the corona virus. As a result, oil prices came under pressure early this year. OPEC countries wanted to limit oil production as well as countries that are not members of OPEC. Russia refused, after which Saudi Arabia decided to increase production to lower the price.

Futures trading

There is an overproduction of oil and there is only one way out: store hydrocarbons. The storage tanks are filled even faster due to the price structure that is now developing on futures market, explains Patrick Kulsen of market research and consultancy company Insights Global. On their tankterminals.com platform, the company has a global database listing all indepedent storage terminals. “In the oil market you have futures trading. This means that you can now buy oil for a delivery in, say, a year. In the meantime, you have to store the oil. This market has accelerated because traders can now buy the oil for a low price and sell it at a high price on the futures exchange. The market is in contango, so the tanks fill up in no time. “

A few months

Kulsen thinks storage tanks will be “or faster” full within six months. Research agency Rystad Energy also thinks that onshore tanks will all be filled within a few months. If that happens, it is still possible to divert to oil tankers, but that storage is more expensive. According to Rystad Energy, that capacity is probably not enough either. Many Very Large Crude Carriers (VLCC) are already in use. Also, the cost of renting a VLCC within a month has gone from about $20,000 to between $200,000 and $300,000.

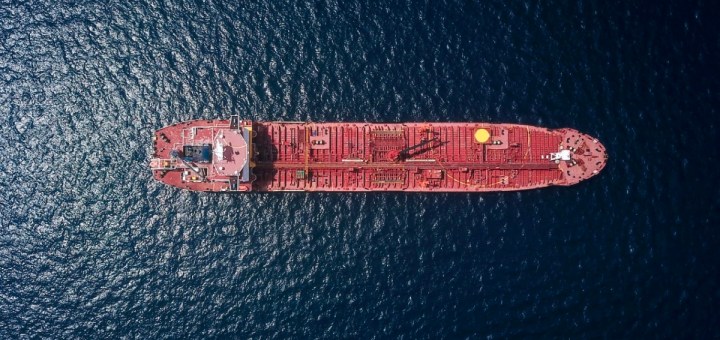
Read the full article on petrochem.nl, Article by Dagmar Aarts, Photo by Marc Rentschler on Unsplash

Lower For Longer: COVID-19’s Impact On Crude Oil And Refined Products

The price of crude has dropped to levels that we have not seen in a generation. The driver for this has been the disagreement between Russia and Saudi Arabia about decreasing production by 1.5 million barrels per day and instead increasing production by about 2 million barrels per day.

The global demand for oil until recently was about 100 million barrels per day. After nearly five years of oversupply, supply had finally come into close agreement with demand.

COVID-19 is adding another, and by most accounts a more serious complication, and one that will last longer.

The impact of COVID-19 has been vastly underestimated by agencies such as the International Energy Agency. They had recently suggested that demand might drop by 90,000 barrels per day; that compares to a prediction in December 2019 that demand would go up by 900,000 barrels per day.

A recent estimate by IHS Markit suggests that we might be in for a bigger shock. They predict that gasoline consumption in the US will drop by 55% for March and April due to COVID-19. They also indicated that jet fuel demand would be halved over the same period. Lastly, they suggest that diesel demand would be down by 20%.

What does this mean? In 2019, the US consumed 20.5 million barrels of crude oil per day. How was that crude oil consumed? On average, 45% of each barrel goes towards making gasoline; 25% towards diesel; 9% towards jet fuel and kerosene. The remaining 21% goes to heating oil, residual fuel, feedstock for plastics manufacturing and other products including paints, resins, etc. If the IHS numbers are correct, then COVID-19 would result in US demand for crude oil dropping to 12.5 million barrels per day. That’s a drop of a whopping 8 million barrels per day of crude oil, or 8% of global crude production!

However, refineries don’t work that way. They take in a staple diet of crude oil and churn out products in roughly the same proportion. Changing the output proportions would cause significant disruptions to refinery operations. Since diesel’s demand is least impacted because of its use in freight transport and will control refinery output, we anticipate that the crude consumption by the US will instead drop by 4 million barrels per day. But this will be accompanied with the rapid growth of inventories for gasoline and jet fuel, at rates of 30% to 35% of average daily consumption accumulating in storage tanks. Should COVID-19’s direct effects on the demand in the US last for two months (roughly how long it took China to start the recovery process), we would have built up additional reserves of gasoline and jet fuel that would last at least an additional month.

With the exception of China, the rest of the world’s economy, notably Western Europe and to a lesser extent South Korea and Japan, is under similar stress as the US economy. China has started to slowly recover after four months of economic pain. Given that, we anticipate that world demand for crude oil is probably down more than 10 million barrels per day, or down more than 10% from last year’s average consumption and production. The additional amount of crude being added into the market by Saudi Arabia and Russia will exaggerate this oversupply. The inventory of crude and refined products will continue to grow, so this oversupplied situation will persist for months after we have overcome the COVID-19 crisis.

It is no wonder that the Texas Railroad Commission, which oversees oil and gas production in Texas, and the US government are considering intervening to slow this inventory buildup using mechanisms not employed in at least 50 years. The Texas Railroad Commission is contemplating restricting production from the state’s oil fields and therefore putting its thumb on the price of oil – a role it had held until the OPEC-led price shock in the 70s. Similarly, the US government is contemplating barring imports of oil, a position it has not taken since the late 50s. While these are unusual times, such measures are unlikely to change the continued depressed price of crude and refined products that exist now and that will exist well after the COVID-19 crisis starts to recede.

We in Texas are looking at lower-for-longer for crude oil no matter what the Saudis and Russians do. And with the buildup of refined product inventories, the refining industry will continue to be depressed.

From Ramanan Krishnamoorti, Chief Energy Officer, March 22, 2020 (Forbes), Photo by Martin Sanchez on Unsplash

Six renewable energy commodities that may someday replace oil & gas

Local generation of wind, solar, hydro and nuclear power, renewable heat and energy conservation together will greatly reduce our dependence on oil, gas and coal exporting countries. Will the energy transition put an end to energy trade?

For most countries, energy independence is just a dream

For nations that never had the luxury of natural resources, renewable energy provides a great opportunity to lessen the dependance on international energy trade. The same goes for nations that already depleted all economically viable reservoirs.

Consequentially, national energy self sufficiency often has been mentioned in support of the energy transition. Self sufficiency however should not be a goal in itself. Costs minimization has been the reason that energy trade has surged over the last decades. Imported coal, oil and gas often simply provide cheaper energy than can be sourced locally.

Costs will of course still be relevant in a carbon constrained world. Regions with favorable climate, favorable geography, low population density, a fleet of operational nuclear power plants or a pragmatic stance on carbon capture will be able to produce low carbon energy far cheaper than less advantageous parts of the world.


It would be naive to suggest that clean energy will not be traded

If the whole world strives to reduce carbon emissions, front runner countries will reach carbon neutral self sufficiency faster than others. From that point on, some countries will almost certainly be able to reduce emissions faster and cheaper via trade than by continuing to strive for total self sufficiency. If part of a country’s energy demand can be met cheaper via imported low carbon energy, low carbon energy will be traded. There is no sound reason not to.

The challenge now is to predict in what forms renewable or low carbon energy will be traded. What will be the commodities of the future? Six likely contenders:


Electricity

Electricity is the fastest growing form of low carbon energy. As a commodity, low carbon electricity is indistinguishable from electricity generated in conventional power plants. Low carbon electricity is fully compatible with existing infrastructure for power transport and distribution. New high capacity power lines enable power trade not just between neighbouring countries but also across whole continents. The problem with electricity is that long term storage is complicated and expensive due to the relatively low energy density of batteries.


Hydrogen

Hydrogen is an energy carrier that can be produced practically carbon neutral. From fossil fuels with carbon capture or via electrolysis using low carbon electricity. As a gas, hydrogen can be transported in bulk via pipelines. Some existing natural gas infrastructure might be repurposed for hydrogen. Below -253 degrees centigrade, hydrogen becomes an energy dense liquid that can be shipped or stored in cryo tanks


Methane, methanol and other hydrocarbons

Methane is a fossil commodity but can also be produced from biomass. Using hydrogen and (non fossil) carbon dioxide, methane can also be synthesized carbon neutral. The same goes for methanol, various oils, lactic acid and almost all useful hydrocarbons that currently are produced at scale from fossil oil. Low carbon variants are chemically identical to current commodities and can make use of existing infrastructure.


Ammonia

Ammonia is a commodity currently produced and traded in bulk for the production of fertilizers and other chemicals. Ammonia nowadays is made mostly from fossil methane but it can be produced carbon neutral using hydrogen and nitrogen. Low carbon ammonia can replace current industrial ammonia consumption. Ammonia itself can also be used as a fuel or as an easily liquefied carrier for transport of hydrogen.


Metal powders

Metal oxidation is a natural process that can be sped up by increasing temperature and exposed metal surface. Metal powder in a flame burns at high temperature. Oxidized metal powder can be regenerated using low carbon electricity or hydrogen. Iron, alumina and other metals are already global commodities. Creating metal powder might be done before transport or on site where stored energy is consumed.


Biomass

Biomass is a low carbon commodity that already has some traction as renewable commodity. Wood chips, pellets, bio-ethanol, biodiesel are the only carbon neutral energy carriers that are already traded at scale between continents. Further scaling however is bound by natural growth rates. Biomass is only carbon neutral if the regrowth of trees and energy crops is in balance with bioenergy consumption.


No clear winner, potential for all

In non carbon neutral form, all potential global energy commodities mentioned above already have their applications in our current carbon intensive economy. Most of those industries will stay just as relevant in a carbon constrained world. For all mentioned carbon neutral commodities therefore it is reasonable to at least meet current consumption without carbon emissions.

Carbon neutral electricity has a head start in replacing its fossil counterpart. Electrification of mobility, heating and some industrial processes furthermore assures that the relevance of electricity will grow in a carbon constrained economy. Except for biomass, all other proposed commodities will also be produced mainly using low carbon electricity.

Which future commodity eventually will replace fossil oil as the world’s main energy carrier, will be decided by energy losses in conversion, practicalities in handling, storage and transport, geopolitics and of course first mover advantages. The transition has started, it’s time to place your bets.

Markets face more turmoil as fears for global economy grow

UK businesses under threat of cashflow pressures because of coronavirus crisis

Financial markets face another volatile week as the escalating coronavirus crisis tips the global economy into a downturn that some companies will struggle to survive.

With France, Spain and Italy in lockdown, a sharp eurozone recession looks inevitable – despite shock emergency action by the US central bank on Sunday night. And while falling share prices captured the headlines last week, analysts believe a corporate debt crisis is building as global growth goes into reverse.

Fears of a cashflow crunch are also rising as self-isolating consumers shun shops and restaurants, and travel links are curbed.

“We cannot underplay the challenge at hand here. A huge proportion of UK businesses face significant cashflow pressures and without cash firms can’t survive for long,” Karim Haji, the head of financial services at KPMG UK warned.

“Banks’ margins are already squeezed, asset managers are especially vulnerable to the current market situation and insurers face the potential double hit of increased claims and decreased portfolios.”

MSCI’s All-Country World Index, the broadest measure of global stock markets, plunged by 12.4% last week, its heaviest losses since Lehman Brothers failed in 2008.

In a late revival, Wall Street surged by 9% on Friday afternoon after Donald Trump finally declared a national emergency over Covid-19.

And on Sunday night, the US Federal Reserve slashed interest rates to nearly zero, as part of a co-ordinated move by central bankers to protect the global economy. The move lowers borrowing costs to their crisis-era low of between 0.0% and 0.25%.

In a coordinated effort to see off a potential global economic crisis, the central bank also said it was working with the Bank of England, the European Central Bank and others to smooth out disruptions in overseas markets.

“The coronavirus outbreak has harmed communities and disrupted economic activity in many countries, including the United States,” the Fed’s rate-setting committee said in a statement. “The Federal Reserve is prepared to use its full range of tools to support the flow of credit to households and businesses.”

But despite central bankers stepping in, airlines face a fight for survival as countries impose flight curbs.

“The shock decision to suspend flights between Europe and the US is about to take a heavy toll on the airline operators but it could be just a warm-up for what is to come now that Spain has declared a state of emergency because of the spread of Covid-19,” Matt Weller of Gain Capital said.

Middle East markets, which traded on Sunday, fell broadly. Egypt’s main share index tumbled by 7%, with Dubai falling 4%.

The sports retailer Nike is closing all its stores in the US, Western Europe, Canada, Australia and New Zealand for more than a week to try to curb the spread of the coronavirus, a reminder of the economic damage being caused.

Corporate bond prices have also come under heavy pressure since the coronavirus crisis began, amid rising fears that firms will default on their debts. Bonds issued by the travel industry, such as the US car-rental company Hertz, fell sharply last week.

“This certainly is another match being lit [near] the bonfire of corporate debt liabilities,” Simon MacAdam, a global economist at Capital Economics, told CNN. “There’s definitely potential for systemic risk.”

Analysts at Nomura predict the eurozone economy will shrink by at least 1.5% in April-June and contract by 0.8% during 2020 as a whole.

After three weeks of losses, some investors are looking for signs that the slump is bottoming out. But without effective, coordinated action, stocks and bonds could slide again – potentially adding to the 29% losses suffered by the UK’s FTSE 100 so far this year.

G7 leaders will hold a conference call on Monday to discuss the crisis – a chance to agree new measures to protect their economies. But the US treasury secretary, Steven Mnuchin, played down the suggestion the US could be falling into recession. insisting coronavirus will be a short-lived problem.

“Later in the year, obviously, the economic activity will pick up as we confront this virus,” Mnuchin told ABC.

The coronavirus pandemic has also hurt Saudi Arabia’s state-owned oil giant. Saudi Aramco promised to cut its spending this year to weather the coronavirus pandemic, after revealing on Sunday that its oil revenues fell by more than a fifth last year because of lower oil prices.

Aramco reported a worse than expected net profit of $88.2bn (£69.9bn) in 2019, down from $111.1bn in 2018, because of lower oil prices. The world’s most profitable company said it plans to spend between $25bn to $30bn this year, down from $32.8bn last year, after the Covid-19 virus wiped out oil demand forecasts for 2020.

The benchmark oil price averaged $64.26 a barrel last year, down from $71.34 a barrel the year before. The current price is below $34 a barrel and is forecast to remain low as the virus threatens a global economic recession.

The oil markets recorded their steepest price drop since the 1991 Gulf war, to lows of $33 a barrel last week, after Saudi Arabia waged an oil price war against rival “petro-nations” by vowing to ramp up oil production to record highs.

The kingdom instructed Aramco last week to raise the maximum rate of oil it can comfortably produce to 13m barrels of oil a day to secure its market share against rising oil exports from Russia and the US.

The Guardian (March 15, 2020)

Hoard now, sell later the mantra as oil storage, freight rates surge

The combination of a massive demand shock caused by the coronavirus outbreak and an unprecedented supply shock after OPEC and its allies failed to agree new production cuts has thrown the oil market off-kilter with prices trading close to four-year lows, leaving shipowners and storage companies best placed to benefit from this tumultuous period.

Freight rates and storage costs are ballooning as the market faces the prospect of more oil just as demand destruction due to the spread of COVID-19 escalates.

“Floating storage turns into a welcome bridge to tie up tonnage and support rates until the current storm subsides,” BRS Shipbrokers Research said in a recent note.

Storage costs have almost doubled in less than week, sharply supported by a stronger contango market structure.

The VLCC Miltiadis Junior was placed on subjects on an 80-120 days time-charter for storage and delivery in the US Gulf at a rate of $60,000/day, according to sources.

This compares with levels of around $28,000-$34,000/day last week, S&P Global Platts estimated.

In a contango market, the forward price of oil is above the prompt price, inferring weak prompt demand and growing oversupply, encouraging storage.

Contango is normally considered a key indicator of a depressed oil market and oil traders have to hoard oil on land or on ships to cut risks.

North Sea opportunities

Slumping crude prices — ICE Brent is currently hovering just below $34/b — is usually a catalyst for charterers and traders alike to look to floating storage as an arbitrage opportunity, with interest in this strategy skyrocketing, according to market participants.

The North Sea paper market has experienced a steepening contango this week as prompt values come under pressure, encouraging sellers to look at storage options while demand both locally and in Asia remains crimped by the coronavirus and refinery maintenance.

Key North Sea grade Forties, for example, is at the moment being stored on four Aframax tankers just outside the UK’s Hound Point terminal, shipping sources said. These vessels loaded at the end of February.

Platts assessed the March 16-20 CFD at a $1.08/b discount to April 13-17 Thursday, this compared with March 5 when March 16-20 was assessed at a 73 cents/b premium to April 13-17, representing the switch from a backwardated to contango structure.

Rates in the ascendancy

Shipowners, however, are preferring to capitalize on long voyages in the current strong spot market, rather than locking their ships away in six-month storage charters.

Freight for the VLCC West Africa to Far east route on a 260,000 mt basis was assessed at Worldscale 140 Thursday, or in excess of $50/mt of crude transported, soaring 183% since last Friday.

Saudi Aramco has said it aims to supply 12.3 million b/d of crude to the market in April, an all-time record for the kingdom. This is almost 30% above what it produced in February and around 300,000 b/d above its maximum production capacity.

This has pushed VLCC rates to fresh highs. The 270,000 mt Persian Gulf to Japan route was assessed at $47.52/mt Thursday, surging 300% from last Monday’s levels of $11.94/mt. The outlook remains extremely bullish with shipowners pushing the market ever higher as they seek to capitalize on the rising market and lock in high profits for long voyages.

Platts (March 16, 2020)

The six days that broke Wall Street’s longest-ever bull market

Investors had long grown used to records in the great stock bull market that ended last week. Longest. Calmest. Highest. It was almost inevitable that the finish would be dramatic.

The saying on Wall Street is shares take an escalator up and an elevator down, but the elevator went in both directions last week. By Friday’s close, stocks in the U.S. notched the biggest one-day rally and rout since the financial crisis. In the end, more than $2 trillion got wiped from American stocks, and global equities saw $6.3 trillion get zapped.

It wasn’t just stocks. Treasuries were up one day, down the next as liquidity worries brewed. Currency volatility — a beast that’s been dormant for years — awakened. Gold’s haven status crumbled.

This is the story of a Wall Street week for the history books.

Sunday: Oil Shock

It’s not even dark in New York when the trading week begins in earnest in New Zealand, 9,000 miles and 17 hours away. It will be a long day.

Over the weekend, Saudi Arabia has effectively declared an oil-price war after the cartel it dominates, OPEC+, failed to reach agreement with Russia. Already in the Middle East, where most exchanges operate on a Sunday-to-Thursday basis, equities have tumbled.

Currencies of energy exporters are the next to react. If the price of their key export collapses it puts immediate pressure on their economies and government finances. The Norwegian krone falls to its lowest since at least 1985 versus the dollar. The Mexican peso drops to a more than three-year low.

Seconds into trading, oil prices have already cratered. Brent crude opens 20% lower and extends losses to as much as 31%, the biggest drop since the first Gulf War in 1991.

The declines won’t stop there. Oil shocks ripple through markets because the commodity has a key role in the global economy. For the countries and companies that produce, it’s a generator of wealth. Oil’s an expensive industry, so small firms in the business tend to have high debts. And it’s an input into many costs in the economy.

What makes this oil shock worse is the timing: Thanks to the coronavirus, global markets are already on edge.

The yield on 10-year U.S. Treasuries, effectively the global benchmark, drops through 0.5% for the first time as investors clamor for safe assets. Futures on the S&P 500 join the sell-off sweeping Asian equities, and before long hit the trading curbs designed to limit the most dramatic moves while cash markets are closed.

All this has occurred before midnight in New York.

Monday: Circuit Breaker

The die is cast before most traders on Wall Street have started out for work, never mind reached their desks. Selling is sweeping Asian stocks, Treasury yields — already at a record low — are extending declines and European equities are down the most since 2016.

With U.S. futures pinned at their lower limit, investors have no way to tell exactly how bad losses will be when the cash market for stocks opens in New York. They get a clue when pre-market trading begins. The exchange-traded funds that track the main American benchmarks aren’t subject to the same limits as futures, and they point to even steeper losses.

When the bell does sound on Wall Street, the rout begins. Losses reach 7% four minutes in, triggering NYSE circuit breakers that halt trading for 15 minutes.

Meanwhile, the oil crash ripples through related products, roiling highly levered exchange-traded notes that play the price of crude.

With the S&P 500 destined for a 7.6% drop and crude set to close down around 25%, investors rush to the safest assets. The dash into Treasuries is so ferocious that the entire U.S. yield curve drops below 1% for the first time in history.

In the swaps market, inflation bets collapse. Policy makers were already struggling to spur price growth; the market believes an oil collapse and deadly epidemic will make it impossible.

The level of doubt is so high they’ll accept less than 1% to lend to the U.S. for 30 years. The decline in the yield of long-dated Treasuries is the biggest on record.

Anxiety is mounting across the markets, exacerbating strains that were already showing up in credit as investors worried about companies’ ability to service debts during the virus outbreak. The cost to protect against default on North American corporate debt surges the most since Lehman Brothers collapsed. An index of leveraged loans drops the most since 2008.

The oil crash throws a spotlight in particular on those companies in the industry with heavy debt loads, many of which fall into the riskier high-yield category.

Sensing the rising risk of a credit crunch — in which investors are no longer willing to lend to the companies and institutions that need it — the Federal Reserve lifts the amount of temporary cash it’s willing to provide markets.

Tuesday: Limits

There is optimism in the air. U.S. stocks just suffered the biggest rout since the crisis, a gift for any investor looking to buy the dip. President Donald Trump has pledged “major” economic announcements later in the day. Despite a brief dalliance in bear market territory overnight, S&P 500 futures are rising. Fast.

Remarkably, a day after the contracts hit their lower trading limit, they hit the upper bound. European shares join the rebound, and while none of the moves come close to erasing the Monday rout, the mood is upbeat on hopes Trump will deliver significant measures to fight both the coronavirus and its economic impact. Even oil bounces back.

All these moves are stirring another asset class, however. Volatility has been climbing in every corner. The Bank of America Merrill Lynch GFSI Market Risk indicator, a measure of expectations for turbulence in stocks, rates, currencies and commodities worldwide, hasn’t risen this fast since the collapse of Lehman Brothers.

Developed-market shares are now more volatile than their peers in emerging nations, which are usually seen as less stable and higher risk. Bets for more oil price swings are the highest on record. But most notably, currency volatility has returned.

Foreign-exchange moves are a huge factor in international capital markets and economies, because they influence the terms of trade between nations, companies and investors everywhere. For years, implied currency volatility has been in retreat amid globalization and coordinated central bank activity, not to mention an era of perpetually low rates and quantitative easing.

Now it’s surging as policy makers rush to tackle the coronavirus impact in different ways, and as investors move their money round the world amid the market turmoil.

The dollar jumps by the most since 2016, a move some attribute to the anticipated American stimulus measures that may give a jolt to the economy. But are there other forces at work? Across global markets the cost of converting other currencies to dollars in the market for so-called cross-currency basis swaps has been creeping up.

In other words, there has been a small but steady increase in the cost of dollar funding — putting participants on high alert for stress in the system, because the greenback is the ultimate global funding currency.

Perhaps these sorts of wrinkles would have gone away if not for events today. Trump doesn’t appear at a White House briefing on the outbreak, and as the day wears on it becomes clear the promised major announcement is not coming. As Wednesday trading begins in Asia — evening in New York — futures for the S&P 500 decline again.

Wednesday: A Bull Dies

Another day, another volte face in major assets. With no stimulus details in sight in the world’s biggest economy, headlines about the virus roll in thick and fast. Italy will close all stores aside from grocery shops and pharmacies. A top U.S. infectious-disease specialist tells lawmakers the pathogen is 10 times more deadly than the seasonal flu.

The bad news culminates when the World Health Organization calls the virus spread a pandemic. In a sense, the designation was a formality in a world where governments were already taking extreme measures to fight its spread. But it crystallizes the crisis for investors; stocks are plunging around the world, oil falling again and the stress in U.S. credit markets worsening.

Gloom descends all across markets. This will be the day the Dow Jones industrial average sinks into a bear market, ending the longest bull run in the history of American equities.

In a bitter twist, for once bonds offer no protection: Investors want to ditch assets that are easy to sell, and despite mounting liquidity worries Treasuries remain among the most tradable.

Away from the virus headlines and price action, a trend is beginning. There are signs that companies in the industries hit hardest by the coronavirus are drawing down credit lines. Shares of Boeing Co. plunge 18% after it says it plans to draw down all of a $13.8 billion loan. Hilton Worldwide Holdings Inc. loses 10% when it announces it will draw some of its credit line. Private equity titan Blackstone Group Inc. asks companies it controls to tap bank facilities to help prevent any liquidity shortfalls.

By the end of the day, policy makers announce plans to ramp up cash injections in the coming weeks to as much as $505 billion in a bid to keep short-term financing markets functioning smoothly through quarter-end.

Details of U.S. fiscal action to cushion the economy from the impact of the pandemic remain sorely lacking, and all hopes are pinned on an address from the president scheduled for that evening.

The bull market in the Dow Jones index has already ended; Trump’s speech winds up sealing the fate of both the S&P 500 and the Nasdaq.

Thursday: Liquidity

Fatalities in Italy rise by a third, France closes all schools, the EU warns the outbreak could overwhelm the bloc’s health-care system and New York City declares a state of emergency.

But it’s largely background noise at this point; the selling has become self-reinforcing after an error-laden speech from Trump containing only small-bore measures to fight the virus. When the European Central Bank decides to keep rates on hold, it seems to confirm to investors that officials aren’t doing enough.

Fears for the economic outlook batter commodities anew. Oil resumes its decline and palladium tumbles more than 20%.

More dislocations appear between major assets, as gold falls along with everything else. Gold usually gains in risk-off episodes because investors consider it a safe haven, but once again it looks like traders may be selling whatever is easy to sell. Bitcoin plunges too as cryptocurrencies implode.

In the U.S., shares are routed. For the second time in a week, the S&P 500’s drop triggers a 15-minute trading halt shortly after the open. The benchmark will close down 9.5% in the biggest one-day decline since Black Monday in 1987.

The potential fiscal hit of the coronavirus suddenly shatters the appeal of the municipal bond market as a refuge, and it experiences the worst day on record.

As sentiment sours, investors and analysts start to contemplate what a sudden surge in demand will do to Treasury bills. The Libor-OIS spread, a measure of how the market is viewing credit conditions, expands to the widest level since 2009. The dollar jumps to the strongest since 2017.

With funding stresses still on display, the Federal Reserve Bank of New York injects almost $200 billion into the system and dramatically increases the amount it’s prepared to inject over the next month, promising a cumulative total above $5 trillion.

U.S. stocks initially pare losses after the surprise announcement, but the seriousness of the situation hits home. Investors now face a growing likelihood that the coronavirus will plunge the global economy into recession.

Friday: Action

The bleakest day in most markets for more than three decades seems to have awakened both policy and law makers.

The Bank of Japan follows the Fed’s liquidity move. Germany pledges to spend whatever’s necessary to protect its economy and the European Commission says it’s ready to green-light widespread fiscal stimulus for euro nations. The ECB signals it’s ready to buy more debt and regulators announce a temporary ban on short-selling stocks.

All told, it helps to distract from yet more bad virus headlines, like the European economy forecast to shrink by 1%, or Spain declaring a state of emergency.

The news of a potential fiscal response in Europe hammers the region’s bonds, but S&P 500 futures once again hit their upper limit. The Stoxx Europe 600 Index surges. Treasuries are down and oil gains, though the moves are small with investors awaiting more comments from Trump.

And then the coda: The S&P 500 powers higher by 9.3% for its biggest rally since October 2008, Treasuries plunge and oil surges after Trump declares a national emergency, signaling a stepped-up response to the crisis.

Almost 6 percentage points of the stock rally come in the final 30 minutes of trading, cutting the weekly rout that at one point reached 16.5% to less than 9%. The 10-year yield almost hits 1%. Oil, boosted by Trump’s pledge to top off the strategic supply, jumps 4.1%.

Outrageous moves to finish an outrageous week, and a fitting end to the longest ever bull market.

Bloomberg, Sam Potter (March 15, 2020)

Tank Storage Demand Drivers – Commercial Performance Model

In this article we would like to explain Insights Global’s tank terminal commercial performance model and why this model offers essential insights into tank storage demand drivers.

Introducing Insights Global’s Conceptual Model

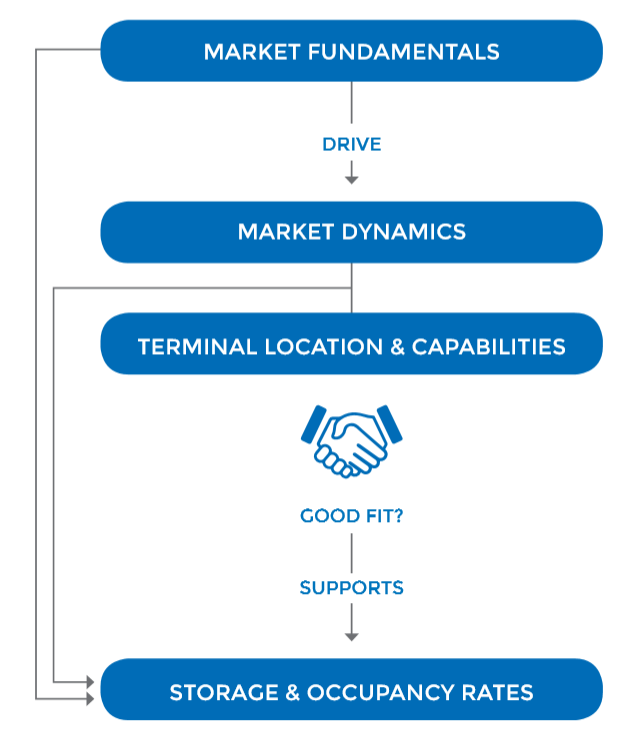
Insights Global’s tank terminal commercial performance model (see figure: 1) shows the relation between a terminal’s market environment and its commercial performance. The environment is divided into market fundamentals (which have a slow rate of change) and market dynamics (which have a fast rate of change). 

In our model the fundamentals drive dynamics. A terminal that has a good fit with market dynamics will find storage rates are being better supported. Besides market dynamics also market fundamentals influence storage rates.

Learn what drives tank storage demand. Join the FREE Webinar: Insights Global Tank Terminal Commercial Performance Model upcoming March 18th 2020.


Detailed graphical representation of ‘Market Fundamentals’ and ‘Market dynamics’ as part of Insights Global’s conceptual model Tank Terminal Commercial Performance

Market fundamentals are:

  • The shape of the forward curve;
  • The competitive structure; and 
  • Logistical factors such as supply, demand, imbalances and trade flows.

Market dynamics are:

  • Inventory levels;
  • Arbitrage and trade flows; 
  • Changes in product spec; and 
  • Variation in vessel sizes.

These variables have a direct impact on a terminal’s operations and on a terminal’s requirements. When a terminal is able to react faster to these dynamics in relation to its competition, it is more likely that it can create superior commercial performance.

Do you want to understand the essential insights into tank storage demand drivers?

In order to explain the essentials of the model we would like to invite you to join our webinar, presided by Insights Global’s Managing Director Patrick Kulsen.

Key highlights of webinar are:

  • Impact of the forward curve on a terminal’s commercial performance
  • Impact of S&D and imbalances on a terminal’s commercial performance
  • Impact of arbitrage and trade flows on a terminal’s commercial performance
  • Explanation of how trading companies make money

Learn what drives tank storage demand. Join the FREE Webinar: Insights Global Tank Terminal Commercial Performance Model upcoming March 18th 2020.

Insights Global’s Tank Terminal Week Report has been based on these essential parametrics that drive tank storage demand. This report will improve your understanding of the world of oil trading and as a result offers you the chance to make intelligent decisions.

Tank Storage Demand Drivers – Arbitrage

Geographical price differences will lead to increased trade! In this article we would like to highlight the subject arbitrage and what this theme has for impact on the tank storage market.

Introduction arbitrage economics

In theory (Investopedia), arbitrage is the simultaneous purchase and sale of an asset to profit from a difference in the price. It is a trade that profits by exploiting the price differences of identical or similar positions on different markets or in different forms. Arbitrage exists as a result of market inefficiencies.

Learn what drives tank storage demand. Join the FREE Webinar: Insights Global Tank Terminal Commercial Performance Model upcoming March 18th 2020.

But how does this work in practice? As commodity trading firm Trafigura describes on their website, they apply three forms of physical arbitrage:

1 – Geographical arbitrage identifies temporary price anomalies between different locations;

2 – Time arbitrage seeks to benefit from the shape of the forward curve for physical delivery (see our article on market structure); and

3 – Technical arbitrage seeks to benefit from the different pricing perceptions for particular commodity grades and specifications

In this article and to make things clear we will focus solely on geographical arbitrage and in particular the Northwest European Singapore arb for heavy fuel oil. 

In order to calculate heavy fuel oil’s price difference between Northwest Europe or ARA and Singapore, we compare the FOB ARA spot price with FOB Singapore swap price, second month due to the duration of the voyage. The difference between these values is the spread and should be large enough to cover the trade costs.

On most occasions heavy fuel oil is shipped to Singapore in a VLCC (Very Large Crude Carrier/310 kt DWT) and loads approximately 270 kt of product. We therefore sum the VLCC freight rate, finance costs, port costs, inspection costs and demurrage to come to total trade costs. Should the spread be more than the trade costs the arb between both regions is open. When the spread is less than the trade costs the arbs is closed.
T

Learn what drives tank storage demand. Join the FREE Webinar: Insights Global Tank Terminal Commercial Performance Model upcoming March 18th 2020.

Importance of arbitrage for tank storage companies

So monitoring if arbs are open (or closed) is a good indication, to understand if trade between two regions is likely to increase. A positive trading environment, ultimately will influence tank storage dynamics.

Please note that arbitrage cannot be seen as a single indicator for business opportunities for tank storage companies. Other indicators that should be taken into account are: price volatility, market structure, and more. These subjects have been highlighted in other articles.

Source: www.trafigura.com

Tank Storage Demand Drivers – Market Structure

The market structure stimulates traders to buy now and sell late. In this article we would like to highlight the themes contango and backwardation and what market structure means for tank storage operators.

Market structure – Introduction to contango and backwardation

An oil price for immediate delivery is called spot price or cash price while an oil price for delivery at a specified date in the future is called a forward price. When we plot these various prices and order them from short to long term delivery, a forward curve is created.

Learn what drives tank storage demand. Join the FREE Webinar: Insights Global Tank Terminal Commercial Performance Model upcoming March 18th 2020.

When a futures price (second month) is below a futures spot price (first or front month), the market structure is in backwardation. In this case, the forward curve is downward sloping. When the futures spot price is below the futures price, the market structure is known as contango. In this case, the forward curve is upward sloping.


Figure 1: Forward curve ICE Brent crude futures

Download Sample Report

A contango usually occurs when supply is higher relative to demand (supply glut) while in a backwardation demand is higher relative to supply (shortage). As time evolves, an oil forward curve can switch from backwardation into contango as in the case of the NYMEX RBOB futures forward curve. When a cyclical pattern is visible, this is called seasonality.

With respect to NYMEX RBOB futures, US gasoline prices tend to rise towards summer driving season during the period June and September. In the period before peak demand, oil traders tend to buy and store products to have product available in times of high consumption.

Learn what drives tank storage demand. Join the FREE Webinar: Insights Global Tank Terminal Commercial Performance Model upcoming March 18th 2020.


Importance of market structure for tank storage companies

In a period of contango, oil traders are encouraged to buy oil products today and sell in the future when the spread between two months covers storage, shipping and finance costs. When this opportunity presents itself, product is being sold, shipped and stored, resulting in more business for tank storage companies. This play is known as a ‘contango storage play’ but is limited by the maximum tank storage capacity available.

In some rare occasions, when the time spread is large enough even tanker vessels are chartered by trading companies to store oil products. This is known as floating storage. In this rare environment demand for tank storage is high and pushes storage rates for spot availability. Backwardation discourages storing oil products as a trader can sell oil today at a better price than in the future.

Is market structure the only business opportunity indicator for tank storage companies?

There are other indicators that should be taken into account such as price volatility, arbitrage and more. These topics and Insights Global’s market model will be covered in upcoming weeks.

Learn what drives tank storage demand. Join the FREE Webinar: Insights Global Tank Terminal Commercial Performance Model upcoming March 18th 2020.