Norway’s electric cars zip to new record: almost a third of all sales

OSLO (Reuters) – Almost a third of new cars sold in Norway last year were pure electric, a new world record as the country strives to end sales of fossil-fueled vehicles by 2025.

In a bid to cut carbon emissions and air pollution, Norway exempts battery-driven cars from most taxes and offers benefits such as free parking and charging points to hasten a shift from diesel and petrol engines.

The independent Norwegian Road Federation (NRF) said on Wednesday that electric cars rose to 31.2 percent of all sales last year, from 20.8 percent in 2017 and just 5.5 percent in 2013, while sales of petrol and diesel cars plunged.

“It was a small step closer to the 2025 goal,” by which time Norway’s parliament wants all new cars to be emissions-free, Oeyvind Solberg Thorsen, head of the NRF, told a conference.

Still, he cautioned that there was a long way to go since two-thirds of almost 148,000 cars sold in 2018 in Norway were powered by fossil fuel or were hybrids, which have both battery power and an internal combustion engine.

The sales figures consolidate Norway’s global lead in electric car sales per capita, part of an attempt by Western Europe’s biggest producer of oil and gas to transform to a greener economy.

The International Energy Agency (IEA), using a slightly different yardstick for electric vehicles that includes hybrids that can be plugged in, showed Norway’s share of such cars at 39 percent in 2017, far ahead of second-placed Iceland on 12 percent and Sweden on six percent.

By contrast, such electric cars had a 2.2 percent share in China in 2017 and 1.2 percent in the United States, IEA data show.

Erik Andresen, head of Norway’s car importers’ federation, said the boom for electric cars was denting Norway’s tax revenues, raising questions about future reforms to raise cash from the 5.3 million population.

Overall, new car sales in Norway fell 6.8 percent in 2018 to 147,929 vehicles, breaking a rising trend in recent years, NRF data showed.

Nissan’s upgraded Leaf electric car was the top-selling car in Norway last year, while other top-selling cars overall ranged from small BMWs and Volkswagens to full-size sedans and electric sport utility vehicles by Tesla.

Sales of pure electric cars surged 40 percent to 46,092 in 2018 while sales of diesel models fell 28 percent, petrol cars were down 17 percent and hybrids that cannot be plugged in fell 20 percent.

The Institute of Transport Economics (ITE), a consultancy, doubted that the 2025 goal for emissions-free new cars could be reached.

“Strictly speaking I don’t think it’s possible, primarily because too many people don’t have a private parking space and won’t want to buy a plug-in car if they can’t establish a charging point at home,” ITE economist Lasse Fridstroem said.

“We may be able to get to a 75 percent (market share), provided that the tax breaks are maintained,” he added.

The Norwegian Electric Vehicle Association (NEVA), a lobby group, predicted a 100 percent market share was feasible.

“We know that charging access is a real barrier … and there’s also a risk that not enough cars become available,” NEVA head Christina Bu said, adding that some customers must wait for a year or more before their electric vehicle is delivered.

Reporting by Alister Doyle, editing by Terje Solsvik/Adrian Croft/Susan Fenton

Rhine Gasoil Barge Flows Grew more than 35%

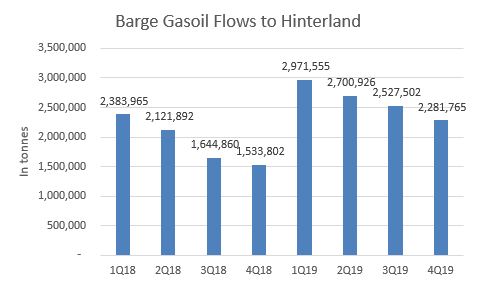
In 2019, more than 10M tonnes of gasoil was transported up the Rhine to German, French and Swiss destinations. The average volume transported by barge up the Rhine on a weekly base was 201K tonnes. The highest volume was 265K tonnes in mid-February. As can be seen from figure 1 the trend during the year is a modest decrease in transported volumes.

Figure 1: Quarterly Barge Gasoil Flows to Hinterland (c) Insights Global

Quarter 1 of last year showed the highest barge export numbers compared to the other quarters. Healthy demand for heating oil during the winter supports higher transports flows. The minimum week volume (138K tonnes) was realized during Christmas when market participants were not active. End-of-year obligations depress volumes in quarter four of

2018 shows a similar pattern with the highest volumes of gasoil barge transports in the first quarter of the year and the lowest volumes in the last quarter. However the trend is more extreme and when we compare the total volume of gasoil that has been exported up the Rhine by barge we see an enormous difference in volume.

In 2018, some 7.6M tonnes was exported. The main reason for the low volume in 2018 were the extremely low Rhine water levels, especially in quarter 3 and 4. During this water level regime barge freight rates spiked to record highs. The average weekly volume in 2018 was 148K tonnes, while the high was recorded in March at 266K tonnes and the low was recorded in October at 85K tonnes.

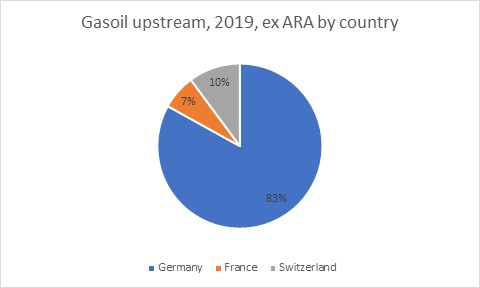
As can be seen from figure 2, most of the gasoil that was transported by barge upstream went to Germany, followed by Switzerland and France. This clearly emphasizes the importance of the river Rhine for the German oil market.

Figure 2: ex ARA destinations for Gasoil per country

For more information on oil product barge flows, check out our Rhine Flow Service Report or request a trial by filling in form below.


    Ship Fuel, Once a Pariah Product, Now Costs More Than Car Fuel

    1. Bunkers now more expensive than other fuels in barrel terms
    2. IMO 2020 rules have triggered demand for low-sulfur product

    (Bloomberg) Once considered the pungent sludge left over after refineries made things like gasoline and diesel, fuel for ships has suddenly become the oil industry’s must-make product.

    The prices of so-called bunkers in Europe have surged this year to such an extent that they’re more expensive than diesel, gasoline and jet fuel — at least in barrel terms, the unit that refineries use to calculate their processing margins.

    The reason for the rally is because the fuel in question just fundamentally changed. On Jan. 1, it became mandatory for most of the world’s merchant fleet to consume fuel containing no more than 0.5% sulfur. Until Dec. 31, a 3.5% upper limit existed in most parts of the world.

    The upgrade — to improve human health and combat environmental concerns — has radically altered economics for refineries in many parts of the world. Some can churn out the new product, others are likely having a tougher time.

    To be clear, at an industrial level, the products in question often trade in and are shipped in metric tons. And on a price-per-ton basis, shipping fuel remains the cheapest of the four products in northwest Europe, despite surging in recent weeks. That’s because it’s much denser than those other products.

    Supply of the new shipping fuel is going through a few teething problems. It’s often made in slightly different ways than the old type. Some testing companies are finding fault with early batches of the new product, even if the full scale of those issues remains unclear.

    By Jack Wittels with assistance by Alaric Nightingale

    Renewables overtake coal as Germany’s main energy source

    FRANKFURT (Reuters) – Renewables overtook coal as Germany’s main source of energy for the first time last year, accounting for just over 40 percent of electricity production, research showed on Thursday.

    The shift marks progress as Europe’s biggest economy aims for renewables to provide 65 percent of its energy by 2030 in a costly transition as it abandons nuclear power by 2022 and is devising plans for an orderly long-term exit from coal.

    The research from the Fraunhofer organization of applied science showed that output of solar, wind, biomass and hydroelectric generation units rose 4.3 percent last year to produce 219 terawatt hours (TWh) of electricity. That was out of a total national power production of 542 TWh derived from both green and fossil fuels, of which coal burning accounted for 38 percent.

    Green energy’s share of Germany’s power production has risen from 38.2 percent in 2017 and just 19.1 percent in 2010.

    Bruno Burger, author of the Fraunhofer study, said it was set to stay above 40 percent this year.

    “We will not fall below the 40 percent in 2019 because more renewable installations are being built and weather patterns will not change that dramatically,” he said.

    Green power skeptics say that output merely reflects favorable weather patterns and does not prove the sector’s contribution to secure energy supplies.

    Solar power increased by 16 percent to 45.7 TWh due to a prolonged hot summer, while installed capacity expanded by 3.2 gigawatts (GW) to 45.5 GW last year, according to the Fraunhofer data.

    The wind power industry produced 111 TWh from combined onshore and offshore capacity of just under 60 GW, constituting 20.4 percent of total German power output.

    Wind power was the biggest source of energy after domestically mined brown coal power which accounted for 24.1 percent.

    Coal plants run on imported hard coal contributed 75.7 TWh, or 13.9 percent of the total.

    Hydropower only accounted for 3.2 percent of power production at 17 TWh, as extreme summer heat dried out rivers and was accompanied by low rainfall. Biomass output contributed 8.3 percent.

    Gas-to-power plants accounted for 7.4 percent of the total; nuclear energy for 13.3 percent; with the remainder coming from oil and waste burning.

    Germany was a net exporter of 45.6 TWh of power in 2018, mostly to the Netherlands, while importing big volumes from France.

    Reporting by Vera Eckert, editing by Susan Fenton

    Gas to overtake coal as world’s second largest energy source by 2030: IEA

    LONDON (Reuters) – Natural gas is expected to overtake coal as the world’s second largest energy source after oil by 2030 due to a drive to cut air pollution and the rise in liquefied natural gas (LNG) use, the International Energy Agency (IEA) said on Tuesday.

    The Paris-based IEA said in its World Energy Outlook 2018 that energy demand would grow by more than a quarter between 2017 and 2040 assuming more efficient use of energy – but would rise by twice that much without such improvements.

    Global gas demand would increase by 1.6 percent a year to 2040 and would be 45 percent higher by then than today, it said.

    The estimates are based on the IEA’s “New Policies Scenario” that takes into account legislation and policies to reduce emissions and fight climate change. They also assume more energy efficiencies in fuel use, buildings and other factors.

    “Natural gas is the fastest growing fossil fuel in the New Policies Scenario, overtaking coal by 2030 to become the second-largest source of energy after oil,” the report said.

    China, already the world’s biggest oil and coal importer, would soon become the largest importer of gas and net imports would approach the level of the European Union by 2040, the IEA said.

    According to Reuters calculations, based on China’s General Administration of Customs data, China has already overtaken Japan as the world’s top natural gas importer.

    Although China is the world’s third-biggest user of natural gas behind the United States and Russia, it has to import about 40 percent of its needs as local production cannot keep pace.

    Emerging economies in Asia would account for about half of total global gas demand growth and their share of LNG imports would double to 60 percent by 2040, the IEA report said.

    “Although talk of a global gas market similar to that of oil is premature, LNG trade has expanded substantially in volume since 2010 and has reached previously isolated markets,” it said. LNG involves cooling gas to a liquid so it can transported by ship.

    COAL AND CARBON

    The United States could account for 40 percent of total gas production growth to 2025, the IEA said, while other sources would take over as U.S. shale gas output flattened and other nations started turning to unconventional methods of gas production, such as hydraulic fracturing or fracking.

    Global electricity demand will grow 2.1 percent a year, mostly driven by rising use in developing economies. Electricity will account for a quarter of energy used by end users such as consumers and industry by 2040, it said.

    Coal and renewables will swap their positions in the power generation mix. The share of coal is forecast to fall from about 40 percent today to a quarter in 2040 while renewables would grow to just over 40 percent from a quarter now.

    However, the world’s coal plants make up one third of energy-related carbon dioxide (CO2) emissions today. Many of those are in Asia, where average coal plants are on average 11 years old with decades left to operate, compared with an average age of 40 years in the United States and Europe.

    “We can create some room for maneuver by expanding the use of Carbon Capture Utilization and Storage, hydrogen, improving energy efficiency, and in some cases, retiring capital stock early. To be successful, this will need an unprecedented global political and economic effort,” said Fatih Birol, the IEA’s executive director.

    Energy-related CO2 emissions could reach a record high this year, the IEA said, and will continue to grow at a slow but steady pace to 2040. From 2017 levels, the IEA said emissions would rise by 10 percent to 36 gigatonnes in 2040, mostly driven by growth in oil and gas.

    But this is “far out of step” with what scientific knowledge says would be required to tackle climate change, it added.

    Reporting by Nina Chestney; Editing by Edmund Blair and Louise Heavens

    Tweedaagse Oil Academy

    20 en 27 maart, 2020

    Vergroot Je Waarde met Meer Kennis

    Uit cijfers van EY (2015) bleek dat in Nederland ongeveer 16.000 mensen werkzaam waren in de olie en gasindustrie. In hetzelfde jaar in Amerika waren dat zelfs bijna 1.5 miljoen mensen! Hierbij zijn nog niet eens de dienstverlenende bedrijven meegeteld. Het is dus een immense sector!

    Het is niet alleen groot qua omvang maar ook qua complexiteit. Veel bedrijven die we tegenkomen begrijpen slechts het onderdeel van de logistieke keten waarin zij actief zijn. Zij missen kennis van de gehele logistieke keten. Juist die andere ketenonderdelen hebben vaak directe impact op de winstgevendheid van hun business.

    Een aantal van deze organisaties hebben bij ons de tweedaagse Oil Academy gevolgd. Na de training zijn zij zich beter bewust van hoe de gehele olie -en gas waardeketen functioneert. Zij begrijpen beter hoe de verschillende marktspelers en fundamentals werken. Al bijna 200 deelnemers gingen u voor en waardeerden deze training met meer dan een 8!

    Voor meer informatie, vraag onze Oil Academy brochure aan door het onderstaande formulier in te vullen.

    ARA Oil Products Stocks Highest Since October

    2 January, 2020 (Argus) — The total volume of oil products held independently in storage in the Amsterdam-Rotterdam-Antwerp (ARA) area rose by around 6pc on the week to reach 11-week highs, according to the latest data from consultancy Insights Global.

    Inventory levels of all products except jet kerosine rose on the week. The highest rise in outright terms was in gasoline inventories, which rose by 13pc on the week to 1.12mn t, the highest since mid-August. Export interest remained low amid poor arbitrage economics to the US, where inventories have risen for seven consecutive weeks and are at nine-month highs. Tankers departed for the Mideast Gulf, the Caribbean, the Mediterranean, Mexico and west Africa. But incoming cargoes of finished grade gasoline and components from France, Russia, Spain and the UK more than offset the outgoing volume.

    Naphtha inventories rose by more than any other surveyed product in percentage terms, increasing by 14.7pc on the week to 289,000t. The total is the highest recorded since March 2019. No tankers departed the area carrying naphtha cargoes, and barge traffic on the river Rhine was subdued owing to a seasonal slowdown in Germany. Naphtha flows into the European hinterland are likely to rise in the coming weeks on firm demand from petrochemical end-users.

    Gasoil stocks rose by 3.5pc to reach eight-week highs of 2.49mn t. Cargoes arrived from Russia and the Baltics, and departed for France and the UK. Gasoil barge traffic around the ARA area and along the river Rhine fell by around 50pc on the week, weighed down by a lack of market activity in Germany but also by relatively mild temperatures that reduced seasonal demand for heating oil.

    Fuel oil stocks in the ARA hub rose by 9.1pc on the week to reach around 1mn t. Rising production of 0.5pc sulphur fuel oil ahead of the IMO 2020 global marine sulphur cap deadline on 1 January probably prompted the stockbuild. Tankers arrived from Denmark, France, Poland, Russia and the UK, and departed for the Mediterranean and west Africa.

    Jet kerosine inventories fell by 3.5pc on the week to reach their lowest since 10 January 2019. The drop in stocks was prompted by high demand in northwest Europe, in line with seasonal expectations. Tankers departed for the UK, and a part-cargo arrived from India.

    By Thomas Warner

    ARA oil products stocks rise on the week

    27 December, 2019 (Argus) — The total volume of oil products held independently in storage in the Amsterdam-Rotterdam-Antwerp (ARA) area rose by around 6pc on the week, according to consultancy Insights Global.

    Inventory levels of all products except jet kerosine rose on the week. The highest rise was seen in gasoline inventories, which rose by 23.3pc on the week to 994,000t, the highest since mid-October. Export interest remained low amid poor arbitrage economics to the US and west Africa, as well as the seasonal gasoline demand lull. Tankers arrived from the Baltic, France, Spain, and the UK, and departed for Brazil, the Mediterranean, and Saudi Arabia.

    The next highest stockbuild was observed in naphtha inventories, which rose by 21.2pc on the week to 252,000t, amid low demand from petrochemical end-users in the ARA area and along the river Rhine. Most naphtha demand in the area is therefore more likely to be coming from gasoline blenders. Naphtha barge flows into the northwest European hinterland rose in early December in anticipation of a seasonal slowdown in trading activity, which depressed trading volumes during the week to yesterday. Tankers arrived in the ARA from Algeria, Denmark, Portugal and Russia.

    Gasoil stocks were built by 1.1pc to 2.4mn t between 19 and 27 December and remain very close to their average of 2.42mn t over the preceding seven weeks. Cargoes arrived from India and the US, while several departed for France as the country’s refineries continued to be severely disrupted. Shipments of US diesel to Europe have been relatively sparse over the past few months, but arbitrage economics on the route are now improving.

    Fuel oil stocks in the ARA hub rose by 6.7pc on the week to reach 923,000t, beginning to recover from a big 15pc draw in the previous week. Rising production of 0.5pc sulphur fuel oil ahead of the IMO 2020 global marine sulphur cap deadline on 1 January was probably the reason for the stockbuild, while economics for European high-sulphur fuel oil’s regular outlet in Singapore have been made unviable in recent months, which could be resulting in more product remaining in tanks. Fresh high-sulphur fuel oil imports from Russia drove stocks higher amid weak export demand, while tankers also arrived carrying fuel oil from the UK and Sweden.

    Jet kerosine inventories fell by 3.8pc on the week to reach their lowest since the week 10 January. The drop in stocks was prompted by high demand in northwest Europe, in line with seasonal expectations. Tankers departed for the UK and Ireland, while no tankers were seen to have arrived into the area over the last week.

    US Storage Market Structure and Outlook (NISTM)

    Insights Global, owner of TankTerminals.com will join NISTM’s 12th Annual Aboveground Storage Tank Conference and Trade Show. This event will be held in The Woodlands (Texas, USA) on December 11 and 12.

    Our colleague, Jacob van den Berge, active as IG’s Marketing and Sales Manager and oil market analyst will be representing our company in the States, birthground of the modern oil industry.

    Especially for the NISTM visitors, Jacob will give a presentation about the US tank storage market focussing on storage players and market outlook. Every day of the conference at 11AM at his stand #814. After each presentation, participants are able to access the slides.

    Learn something new by joining!

    Register below:

      Proven Research Methodology

      IG’s conceptual model shows relations between market circumstances and a terminal’s commercial performance. In this model market fundamentals drive market dynamics. A terminal that has a good fit to these market dynamics will find that their storage rates are supported.

      Apart from this direct relation between tank terminal characteristics, market dynamics and storage rates, there is also a relation between market fundamentals and storage rates.

      The distinction between market fundamentals and market dynamics lies mostly in the difference in rate of change. Market fundamentals tend to be more stable compared to market dynamics.

      Market dynamics have a direct relation to operational activities at tank terminals. Main focus points are related to market fundamentals: logistics, forward curve outlook and competitive structure. Furthermore, expected impact on market dynamics and corresponding tank terminal operations will also be taken into consideration.

      Request Our Research Methodology