Proven Track Record

Since the beginning of 2000, Insights Global has been involved in numerous consultancy assignments.

These ranged from market studies of specific sectors such as the chemical, wholesale and retail, tank storage, trading and shipping, and oil industry.

Also, different regions have been covered such as Northwest Europe, Mediterranean, ARA, Singapore, and the US.

Since 2014, Insights Global has been heavily involved in due diligence projects of storage assets, specifically commercial DD. Some of these were part of the winning bid.

Register for Our Track Record

ARA oil product stocks at 12-week low

22 August, 2019 (Argus) — Inventories of oil products independently held in Amsterdam-Rotterdam-Antwerp (ARA) fell below, the lowest since the week to 31 May.

Gasoil inventories fell with barge flows up the river Rhine increasing for the third consecutive week. Lower barge freight rates have encouraged loadings on the river. A tanker departed for northern Germany.

Gasoline inventories fell on the week to reach their lowest since the week to 31 May. The week-on-week drop was the heaviest recorded since March 2017, because of a temporary rise in exports to the US Atlantic coast and higher demand from Germany. Buying interest from the country rose week on week as a result of production issues at the Miro refinery.

Naphtha inventories dropped to reach their lowest level since May 2016. Scheduled maintenance at petrochemical facilities in northwest Europe continues to weigh on demand, pressuring prices downward and reducing the number of cargoes arriving in the area. Meanwhile, local demand for the grades used in gasoline blending has increased.

Fuel oil inventories rose on the week, after falling the previous week. No tankers departed for Singapore, but two very large crude carriers (VLCCs) remain in the Rotterdam area, and could potentially load cargoes.

Jet fuel stocks in ARA fell to reach their lowest since 21 March. Demand from the aviation sector remained firm in line with seasonal expectations.

Make intelligent decisions!


    Inventories of oil products independently held in ARA fell

    16 August, 2019 (Argus) – Inventories of all surveyed products fell week on week, with the exception of gasoline stocks which reached fresh six-month highs. Gasoline inventories rose on the week to their highest since 7 February as market participants arranged cargoes ready for export to the US and West Africa. Barge congestion remained a factor in the Amsterdam area for the second consecutive week with barges and tankers competing for loading and discharge terminals. Outflows to the US and West Africa rose week on week and tankers also departed for west Africa. Tankers arrived in ARA from France, Germany, Sweden and the UK.

    Naphtha inventories fell following a week-on-week fall in imports. Demand from along the river Rhine fell owing to upcoming petrochemical plant maintenance in Germany. Interest from gasoline blenders was more robust and most of the incoming naphtha was probably destined for the northwest European blending pool. Tankers arrived from Algeria, Norway, Russia and the UK.

    Gasoil inventories fell with inland demand for diesel prompting the second consecutive week-on-week rise in barge flows up the river Rhine. The volume of incoming gasoil rose on the week and tankers arrived from Russia and the US. But more gasoil also left the area, with tankers departing for France, the Mediterranean and the UK.

    Fuel oil inventories fell by on the week. The Suezmax Militos departed Rotterdam for Singapore and tankers also departed for west Africa. Demand for high sulphur fuel oil is under long-term downward pressure from upcoming changes to maritime fuel regulations. Tankers arrived from the Black Sea, Latvia, Poland and Russia.

    Jet fuel stocks in ARA fell by to reach their lowest since 11 April. Demand from the aviation sector was firm in line with seasonal expectations, and no jet fuel tankers arrived from elsewhere. An anticipated turnaround at South African firm’s 105,000 b/d Engen refinery has prompted the diversion of two jet fuel tankers to the area that were originally expected to discharge in northwest Europe. Tankers departed the ARA area for Ireland and the UK.

    Make intelligent decisions!


      ARA oil product stocks stable on the week

      8 August, 2019 (Argus) — Inventories of oil products independently held in the Amsterdam-Rotterdam-Antwerp (ARA) storage hub have fallen in the past week..

      Stocks of most surveyed products fell slightly week-on-week, with the exception of naphtha and gasoline, which rose to four-week and six-month highs respectively. Gasoline inventories reached their highest weekly level since early February, driven by market participants collating cargoes ready for export to the US and west Africa. Congestion returned to the Amsterdam area after a temporary lull, with barges and tankers competing for loading and discharge terminals. Blending demand for west African grade gasoline has firmed following last month’s direct sale-direct purchase (DSDP) award by Nigerian state-owned NNPC for its 2019-20 gasoline requirements. Blending demand for US-grade gasoline also remains robust, as European cargoes continue to make up the shortfall arising from a fire at Philadelphia Energy Solutions’ refinery in Philadelphia in June. Gasoline cargoes have arrived in the ARA area from Finland, the Baltics, France, Italy, Russia and the UK in the past week.

      Naphtha inventories rose by substantially on the week to reach their highest level since the week to 11 July. Rising supply in northwest Europe pushed the naphtha market briefly into contango today, with prompt prices weaker than contracts for delivery further forward. Tankers carrying naphtha arrived in the ARA area from Algeria, France, Norway, Poland and Sweden in the past week, while none departed. Demand from gasoline blenders working to meet export demand appeared stronger than demand from petrochemical customers, many of whom are preparing for scheduled maintenance turnarounds.

      Gasoil inventories fell in the past week, with rising water levels supporting demand from buyers along the Rhine in Germany. Gasoil barge trade within the ARA area was slow, particularly in comparison with gasoline. Gasoil cargoes arrived in ARA from Russia and Saudi Arabia and departed for France and the UK.

      Fuel oil inventories fell on the week. The very large crude carrier (VLCC) Ridgebury Pride had been scheduled to load 270,000t from Rotterdam around 3 August for delivery to Singapore, but remains at anchor in the North Sea unladen. Fuel oil tankers arrived in the ARA area from Poland and Russia and departed for west Africa. Demand for high-sulphur fuel oil is under long-term downward pressure from upcoming changes to maritime fuel regulations.

      Jet fuel stocks in the ARA hub fell to reach nine-week lows. Demand from the aviation sector was firm, in line with seasonal expectations, and no jet fuel tankers arrived from elsewhere.

      Global tank terminal markets: current status and outlook

      To say that the global tank terminal business is large is an understatement. There are more than 4900 tank terminals comprising more than 1 billion cubic meters of storage capacity. The business has grown at a compounded annual growth rate of 3% since 2005 and in coming years another 10% will be added to global tank capacity. Some might argue that capacity has grown too fast and that we are approaching a situation where markets are ‘over-tanked’. But is this really the case? This is a very relevant question for many players. For instance, if you are a business development manager at a terminal operator you need to understand this because it can guide you in determining if and where to invest. Another example are investors. If you are an investor in infrastructure assets you need to understand this in order to decide on investing or divesting in and valuating terminal assets.

      So understanding the balance between supply and demand for terminal markets is very important for many people. One thing to keep in mind is that terminal markets are on the one hand very local in nature but on the other hand these markets are driven by global factors such as trade flows and commodity price dynamics. This makes these markets rather complex. Nevertheless in this article we will try to shed some light on this topic in order to unravel this complexity. We will take the approach to focus on how tank terminals are used by their clients and how this adds value to these clients. To support this approach we will use INSIGHTS© GLOBAL’s model on terminal functions.

      • Logistics/hub function
      • Trading platform
      • Strategic storage

      Every terminal essentially has a logistics or hub function. This is the prime function. Some terminals are also used as a trading platform by its clients. Physical commodity traders require terminals for their business model. The last function a terminal can have is to store crude or oil products as part of a country’s strategic petroleum reserves. This last function is interesting for a specific terminal operator but from an economic analysis point of view less relevant because it is dependent on specific policies defined by governments. We therefore leave this function outside of the scope of this article.

      So we will focus of the logistics and trading platform functions. After careful analysis of these functions and the value it can bring to clients of terminals we concluded that there are three key factors that act as business indicators for tank terminal markets:

      • Commodity price dynamics
      • Inventory levels
      • Trade flows

      If you are analyzing business at a specific terminal you need to look at these factors in the local context. However, for the purpose of this article we have looked at these factors on a global scale and we have focused on oil markets.

      Oil price dynamics

      Current oil price levels are low and rather volatile. The low price levels stimulates demand and the increased volatility creates trading opportunities. The forward curve is downward sloping (backwardation) which weighs on arbitrage opportunities. However, some institutions like the EIA are forecasting a slight oversupplied global crude market, which could soften the backwardation or even flip it to a contango, which would be good news for the terminal sector.

      Inventory levels

      Global crude and oil product inventories are on the lower end. This is related to the backwardation price structure. So tanks are slightly underutilized right now.

      Trade flows

      Global crude and oil products trade flows have been increasing at a steady rate in the last decade. This rate resembles the growth rate in tank capacity and thus signals that the balance between tank capacity and tank demand is more or less balanced. This is a very positive sign.

      The main conclusion from the above analysis is that the global market does not seem to be over-tanked and that the current situation is set to improve significantly after oil price dynamics change to fully support the terminal business. So the future is definitely bright for the terminal business!

      About the author

      Patrick Kulsen is Managing Director and Senior Consultant at INSIGHTS GLOBAL, a market research company specialized in oil and petrochemical markets. The company’s consultancy team has successfully helped clients with research and commercial due diligence projects for many years. For more information on our consultancy services please follow this link.

      Tank Storage Assets Portfolio Analysis

      Introduction

      In the last decade the tank terminal markets has seen quite a large number of Merger & Acquisition deals. One of the main trends that has been witnessed is that investments funds are stepping in and in many cases are emerging as winners of these bids. As an investor or fund manager you might wonder “Is the tank terminal sector worthwhile getting into?” or “Is the opportunity at hand going to diversify my investment portfolio?”. This blog post will try to give guidance on this subject.

      Infrastructure Asset Class

      Tank storage assets, due to their resilient and stable revenue profile are considered infrastructure assets. Such assets are attractive investments if it fits the risk/return profile of your fund. Nevertheless there are some nuances that need to be made. Not all terminals are alike so a more detailed approach is needed to distinguish between various groups of terminals. From an investment portfolio perspective it is sensible to group terminal assets into different categories based upon their exposure to business risks.

      1. Location, location, location…

      One obvious characteristic is the location of the terminal. For one, country risk is associated with the location of the terminal. Is the terminal located in an OECD country or not might be a good way to look at this. However location of terminals has many more implications. It is the single largest factor driving value of terminal assets due to various reasons. Most likely if you ask experts the question “what is are the three most important terminal characteristics” they’ll answer “location, location and location”. So the conclusion is that a thorough analysis of the implications of terminal location is needed.

      A rather simplistic but effective first order categorization is to group terminals into Hub Location and Non-Hub Location terminals. The hub location terminals are well positioned and are better able the weather downturns in business cycles. Additionally, these terminals are less sensitive to local and regional economic circumstances. Business activity at hub terminals is related to global trade, which is less volatile and thus has a lower risk profile.

      Another categorization method is to distinguish between sea-access and inland terminals. This grouping has some overlap with the functional categorization that will be discussed in the next section. Nevertheless it gives additional insights into the risk profile because sea-access terminals offers more flexibility for its customers and has a larger operating region. On the other hand, inland terminals are more restrictive and are in most cases confined to the local area. This doesn’t mean that these assets are worthless, they can be very profitable. However, they do have a different risk profile.

      2. Market Segment

      After location the second question you need to ask is: what liquid products are stored at the terminal? Products can be categorized into the following main groups: crude oil, petroleum products, pressurized gasses (such as LPG), LNG, chemicals, vegetable oils, bio-fuels and others. For petroleum products and chemicals sub-categories apply, but let’s not overcomplicate matters here. The point is that for instance petroleum product markets have a different dynamic than chemical markets. This translates to a different risk profile for the terminal business. So market segments are a key characteristic.

      3. Terminal Functions

      A tank terminal can have one or more functions for its clients. These functions are driven by business environment and the infrastructure of the specific terminal. The main functions applicable to terminals are:

      -Logistics / hub function:
      o Make /break bulk hub
      o Distribution & inter-modality hub
      o Integration with industrial site
      o Bufferstock

      -Trading platform:
      o Physical arbitrage
      o Blending
      o Contango storage
      o Optionality

      -Strategic storage

      Uncovering dominant functions related to the specific terminal that is up for sale gives insights into its business and the related risks.

      Putting it together: does it fit?

      By combining the above mentioned locational, market segment and functional aspects the terminal asset can quickly be profiled to see if it contributes to the diversification of your portfolio. A diversified terminal asset portfolio should preferably have a variety of assets that ranges across different locations, markets segments and incorporates a varied set of functions. If too many assets are in the portfolio that have similar risk profiles the portfolio might be too exposed to a certain risk.

      The above mentioned characteristics have the ability to frame the asset. But please keep in mind that a more detailed approach is required later on in the process as part of the commercial due diligence project.

      Terminal Portfolio Compatibility Call (FREE)

      The above described methodology gives an outline of an approach that can be applied to check if a terminal asset fits your investment portfolio. However, elaborating on all relevant details is outside the scope of this article. Additionally a lot of data is needed to profile terminals. So you might need help to fully implement this method. We can help you with this. Please contact me for a free and confidential terminal portfolio compatibility call. In this call, I will apply this method to your investment opportunity so you have instant insights into the risk profile.

      About the author

      Patrick Kulsen is Managing Director and Senior Consultant at INSIGHTS GLOBAL, a market research company specialized in amongst others commercial due diligence of tank terminals. The company’s consultancy team has successfully helped clients during M&A projects for many years. For more information on our consultancy services, please follow this link.


      The hottest terminal locations of 2020

      In the world of international tank storage, thousands of terminals give access to commercial storage. These terminals are located all over the world. From large tank farms in oil trading hubs in ARA, USGC, Fujairah and Singapore to small depots on Guam or Greenland.

      The tank storage sector is not a static industry but a dynamic one which grows every year. It is interesting to find out which regions have the most investments planned or are currently building new additions.

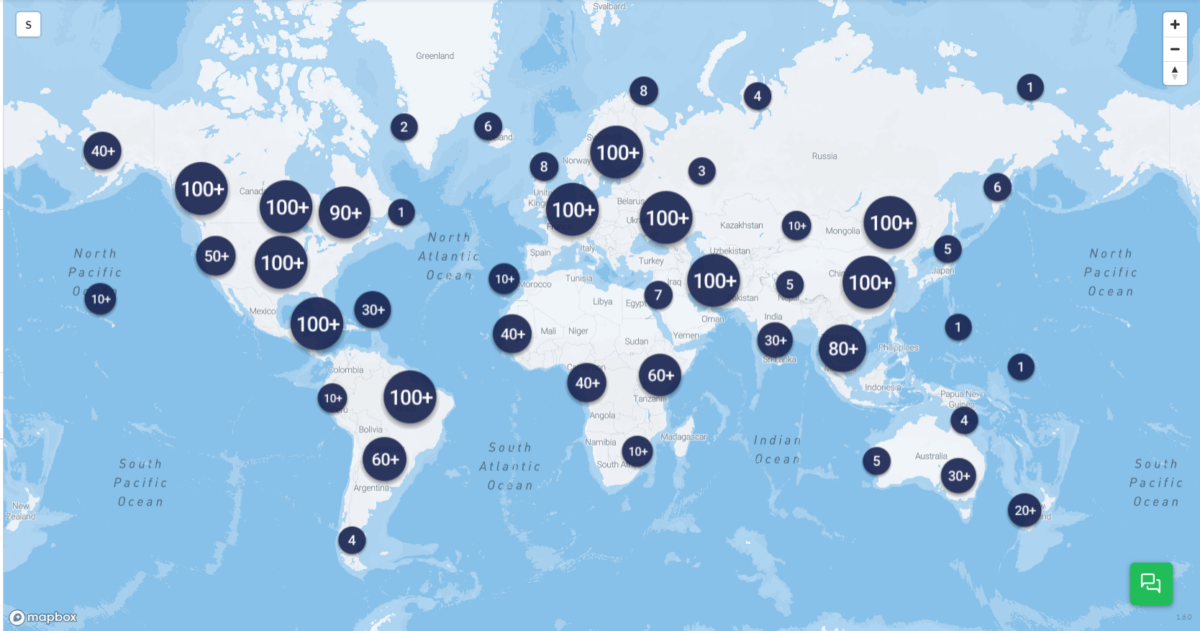
      In picture 1 can be seen where the largest concentrations of tank terminals are.

      The world’s hottest storage hotspots

      Estimates are that global tank storage capacity will grow 8% to 1.03 billion cbm in 2020 and even 11.5% to 1.06 billion cbm in 2021.

      When ranking the regions with the largest total tank capacity in 2019 the following list can be produced: 1) Asia (360Mcbm), 2) Europe (235Mcbm), 3) North America (191Mcbm), 4) Middle East (50.8Mcbm), 5) South America (45.5Mcbm), 6) Africa (43.6Mcbm), and 7) Oceania (4.4Mcbm).

      In 2020 the ranking is as followed: 1) Asia (383.7Mcbm), 2) Europe (244Mcbm), 3) North America (207Mcbm), 4) Middle East (93.3Mcbm), 5) Africa (48.9Mcbm), 6) South America (47.8Mcbm), and 7) Oceania (4.7Mcbm).

      Analyzing this list some remarkable conclusion can be taken:

      -The Middle East will show the strongest growth rate with 84% in 2020 as capacity in this regions grows from 50.8Mcbm to 93.3Mcbm;

      -Africa will leapfrog South America and take position 5. This continent shows a growth rate of 12%. Storage capacity increases from 43.6Mcbm to 48.9Mcbm.

      -Europe will grow by 4% till 2020 and is the slowest growing region of all the 7 regions. Capacity in this region grows from 235Mcb to 244Mcbm

      Although, looking at regions is sort of looking at it as from a macro-level perspective, we can well say that the Middle East will be the hottest tank terminal location in 2020. There are some interesting locations in the Middle East that have a substantial part in the additions in this region.

      Fast growing areas in the Middle East

      Oman Tank Terminal in Raz Markaz

      In Oman storage of oil liquids is concentrated around the ports of Salalah, around Oman’s capital Muscat and Sohar’s industrial area. Oman’s government owned investment company OOC, Oman Oil Company announced a major investment in 2012 on building a massive 31Mcbm crude storage facility in Ras Markaz. Some 200 tanks will be added. Estimates are that this terminal will be operational as from June 2019. With this investment Oman is trying to develop its position as an important global trading and storage hub.

      South Oil Company in Iraq

      Roughly said, Iraq has storage facilities in its oil fields in the North, around Kirkuk, Al Anbar and Erbil and in the South, around Basrah. Most of these terminals are controlled by the Ministry of Oil of the Republic of Iraq. Government-owned South Oil Company will add 2.78Mcbm of crude capacity in Al Zubair and another 0.464Mcbm in Fao. For the first addition applies that some 489 crude tanks will be built. December 2019 has been pointed as data of operation. For the latter, applies that 5 tanks will be built and this expansion is planned to become operational in December 2020.

      Jask Oil Terminal in Iran

      In Iran, storage facilities are controlled by state-owned Iranian Oil Terminals CO. These terminals are mostly located at the Persian Gulf and the gulf of Oman, connected with each-other by the infamous Strait of Hormuz. Not in the 2019 and 2020 numbers but definitely worth mentioning is the 10Mcbm crude addition in Jask. Jask is peninsula that runs into the Gulf of Oman. The Jask Oil Terminal will include 20 tanks with floating roofs. he terminal will also include loading and unloading wharves, offshore facilities including three single-point mooring (SPM), and other infrastructure for import/export oil. Estimates are that this addition will be active in December 2021.

      The data for this article was gathered with the support of tankterminals.com’s database platform. With only a few clicks and couple of seconds the information of the biggest market players in the various regions was obtained.

      For more information, contact:
      Jacob van den Berge, Head of Marketing & Sales Insights Global

      Who are the biggest players in the tank terminal market?

      In the global commercial tank storage industry thousands of terminal operators are active. Without taking a terminal operator’s specific function, it is interesting to learn who the biggest players are in the international tank terminal industry.

      In picture 1 can be seen where the largest concentrations of tank terminals are.

      Looking on a global level the following top 10 terminal operators can be derived. See table 1.

      Rank

      1.

      2.

      3.

      4.

      5.

      6.

      7.

      8.

      9.

      10.

      Head office

      Sinopec

      Vopak

      CNPC

      Kinder Morgan

      PetroChina

      Buckeye

      Oiltanking

      Marathon

      Enterprise

      Magellan

      # of terminals

      51

      69

      24

      96

      34

      114

      73

      99

      55

      93

      Capacity

      44.1Mcbm

      33.1Mcbm

      25.7Mcbm

      21.7Mcbm

      19.8Mcbm

      18.1Mcbm

      17.6Mcbm

      16.7Mcbm

      13.2Mcbm

      13.1Mcbm

      As can be seen in this list, based on total capacity, the biggest players are located in China with Sinopec, CNPC and PetroChina, followed by US with Kinder Morgan, Buckeye, Marathon, Enterprise and Magellan and Europe with Vopak and Oiltanking. With a combined total capacity of 223Mcbm, the top 10 players cover around 21% of the total capacity globally.

      A bit more details on the three biggest storage operators

      Sinopec Group, Chinese dragon at the top of the food chain

      Sinopec Group, China Petroleum and Chemical Corporation, is a Chinese energy company based in Beijing (China). It is the second largest oil producing company after PetroChina. Besides 50 terminals (with a total storage capacity of 44Mcbm, mostly located in China) and 30.000 petrol stations, this company operates dozens of refineries, around half of the Chinese refinery capacity. Sinopec has various listings on stocks exchanges but for the majority the shares remains in the hands of the Chinese government. In 2017, total revenues was around €300 billion.

      Vopak, Dutch giant with a global storage print

      Vopak is an independent storage player with a long history dating back to the early 16the century. Independent means it does not own the oil products its stores. It therefor holds an independent position in the market unlike for instance Sinopec and CNPC, the number 1 and 3 in the list. The 69 terminals of Vopak are scattered around the globe. It has locations in more than 20 countries with largest concentration of terminals in the Netherlands, followed by China and the US. In 2018, Vopak’s revenues lay at €1.25 billion.

      China National Petroleum Corp, a powerful energy emperor

      CNPC is a one of the biggest vertical integrated oil companies in the world. Its origins date back to 1949 when communist China was formed. The company rose from Ministry of Petroleum which secured and managed the country’s fuel. It operates oil assets in more than 30 countries, except for the 24 storage terminals (with a total capacity of 25.7Mcbm) which are mainly located in the Chinese homeland. In the downstream area it also operates more than 20.000 petrol stations.

      Are storage capacity market shares equal across the globe’s regions?

      Is the global division of market shares similar for the different regions? Absolutely not. Let us analyze the regions with the largest concentration of terminals. The regions with the most terminals are the United States (1.447), Europe (1,125) and Asia (1.057).

      In the United States, the tank storage is dominated by publicly owned storage operators with US origins. The top three consist of 1) Kinder Morgan, 2) Magellan and 3) Buckeye. The remainder of the top 10 consists only out of US-born tank storage players.

      In Europe, the top 3 biggest players are 1) Vopak, 2) Oiltanking and 3) CLH. These companies are also publicly owned and have a broad international coverage which means they have a global storage footprint. For instance Vopak is ranked number 6 in Asia and Oiltanking is ranked number 12 in Asia.

      In Asia the top 3 consist solely of Chinese state-owned companies: 1) Sinopec, 2) CNPC and 3) PetroChina. Their number four is a Japanese company, JX Nippon Corporation and the number five as the Korean Gas Corporation. As mentioned before, ranked six is Vopak.

      As can be concluded, the global players take a large piece of the pie. However, there is enough room for other tank terminal players to operate a sustainable business in specific regions, countries or ports. Furthermore, the competitive dynamics differ per region, so tank terminal players face different opponents in various regions.

      The data for this article was gathered with the support of TankTerminals.com’s database platform. With only a few clicks and couple of seconds the information of the biggest market players in the various regions was obtained.

      Request A Sample

      For several years, Insights Global has published market outlook reports on oil products for the ARA region. This report has been revised on a year-on-year basis.

      As from 2018, we have produced new market outlook reports, now covering ARA & chemical products and Singapore & oil products. Our intention is to cover all major trading hubs for both research areas.

      In this registration form, you are able to select the trading hub and research area of interest. Just fill in your name and e-mail address. You can make multiple selections. We will sent over a sample report and contact you shortly.