The hottest terminal locations of 2020

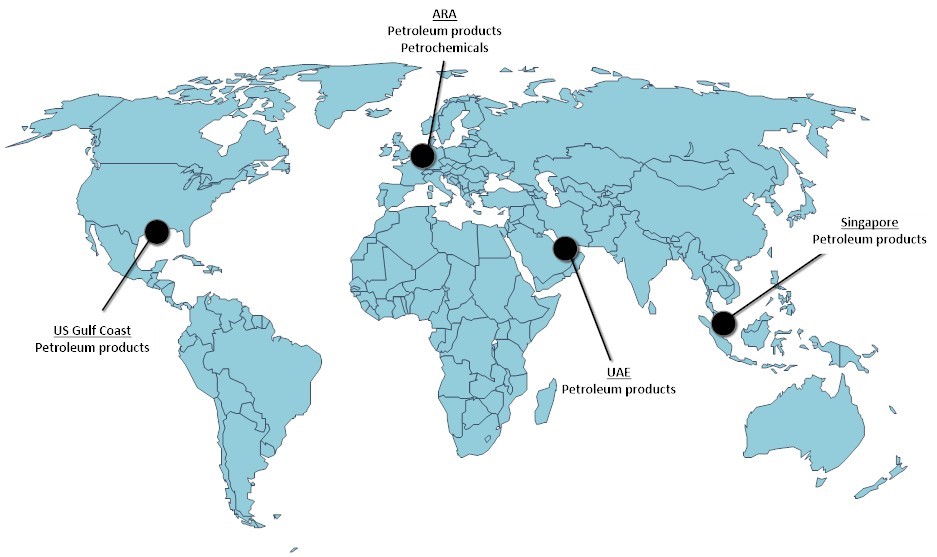
In the world of international tank storage, thousands of terminals give access to commercial storage. These terminals are located all over the world. From large tank farms in oil trading hubs in ARA, USGC, Fujairah and Singapore to small depots on Guam or Greenland.

The tank storage sector is not a static industry but a dynamic one which grows every year. It is interesting to find out which regions have the most investments planned or are currently building new additions.

In picture 1 can be seen where the largest concentrations of tank terminals are.

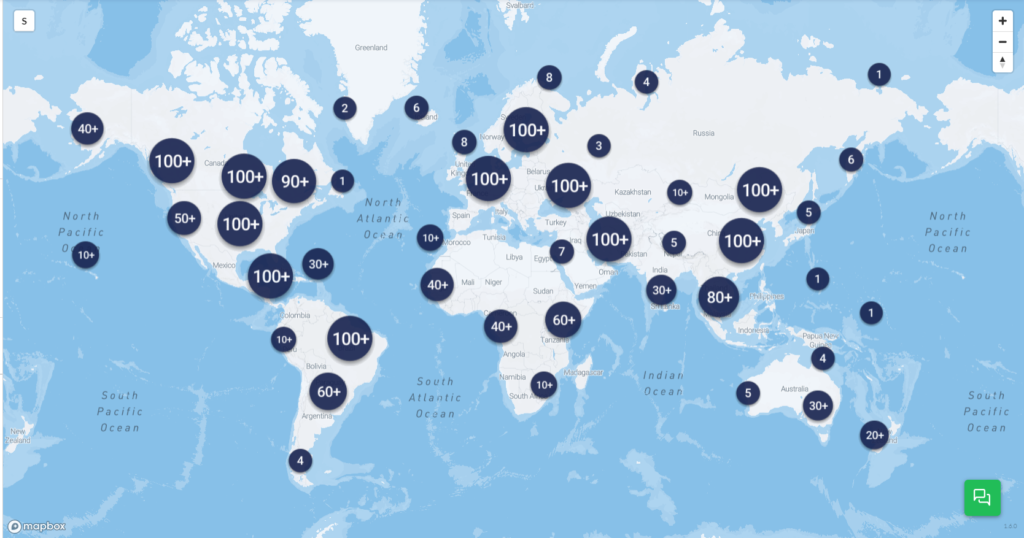
The world’s hottest storage hotspots

Estimates are that global tank storage capacity will grow 8% to 1.03 billion cbm in 2020 and even 11.5% to 1.06 billion cbm in 2021.

When ranking the regions with the largest total tank capacity in 2019 the following list can be produced: 1) Asia (360Mcbm), 2) Europe (235Mcbm), 3) North America (191Mcbm), 4) Middle East (50.8Mcbm), 5) South America (45.5Mcbm), 6) Africa (43.6Mcbm), and 7) Oceania (4.4Mcbm).

In 2020 the ranking is as followed: 1) Asia (383.7Mcbm), 2) Europe (244Mcbm), 3) North America (207Mcbm), 4) Middle East (93.3Mcbm), 5) Africa (48.9Mcbm), 6) South America (47.8Mcbm), and 7) Oceania (4.7Mcbm).

Analyzing this list some remarkable conclusion can be taken:

-The Middle East will show the strongest growth rate with 84% in 2020 as capacity in this regions grows from 50.8Mcbm to 93.3Mcbm;

-Africa will leapfrog South America and take position 5. This continent shows a growth rate of 12%. Storage capacity increases from 43.6Mcbm to 48.9Mcbm.

-Europe will grow by 4% till 2020 and is the slowest growing region of all the 7 regions. Capacity in this region grows from 235Mcb to 244Mcbm

Although, looking at regions is sort of looking at it as from a macro-level perspective, we can well say that the Middle East will be the hottest tank terminal location in 2020. There are some interesting locations in the Middle East that have a substantial part in the additions in this region.

Fast growing areas in the Middle East

Oman Tank Terminal in Raz Markaz

In Oman storage of oil liquids is concentrated around the ports of Salalah, around Oman’s capital Muscat and Sohar’s industrial area. Oman’s government owned investment company OOC, Oman Oil Company announced a major investment in 2012 on building a massive 31Mcbm crude storage facility in Ras Markaz. Some 200 tanks will be added. Estimates are that this terminal will be operational as from June 2019. With this investment Oman is trying to develop its position as an important global trading and storage hub.

South Oil Company in Iraq

Roughly said, Iraq has storage facilities in its oil fields in the North, around Kirkuk, Al Anbar and Erbil and in the South, around Basrah. Most of these terminals are controlled by the Ministry of Oil of the Republic of Iraq. Government-owned South Oil Company will add 2.78Mcbm of crude capacity in Al Zubair and another 0.464Mcbm in Fao. For the first addition applies that some 489 crude tanks will be built. December 2019 has been pointed as data of operation. For the latter, applies that 5 tanks will be built and this expansion is planned to become operational in December 2020.

Jask Oil Terminal in Iran

In Iran, storage facilities are controlled by state-owned Iranian Oil Terminals CO. These terminals are mostly located at the Persian Gulf and the gulf of Oman, connected with each-other by the infamous Strait of Hormuz. Not in the 2019 and 2020 numbers but definitely worth mentioning is the 10Mcbm crude addition in Jask. Jask is peninsula that runs into the Gulf of Oman. The Jask Oil Terminal will include 20 tanks with floating roofs. he terminal will also include loading and unloading wharves, offshore facilities including three single-point mooring (SPM), and other infrastructure for import/export oil. Estimates are that this addition will be active in December 2021.

The data for this article was gathered with the support of tankterminals.com’s database platform. With only a few clicks and couple of seconds the information of the biggest market players in the various regions was obtained.

For more information, contact:
Jacob van den Berge, Head of Marketing & Sales Insights Global

Who are the biggest players in the tank terminal market?

In the global commercial tank storage industry thousands of terminal operators are active. Without taking a terminal operator’s specific function, it is interesting to learn who the biggest players are in the international tank terminal industry.

In picture 1 can be seen where the largest concentrations of tank terminals are.

Looking on a global level the following top 10 terminal operators can be derived. See table 1.

Rank

1.

2.

3.

4.

5.

6.

7.

8.

9.

10.

Head office

Sinopec

Vopak

CNPC

Kinder Morgan

PetroChina

Buckeye

Oiltanking

Marathon

Enterprise

Magellan

# of terminals

51

69

24

96

34

114

73

99

55

93

Capacity

44.1Mcbm

33.1Mcbm

25.7Mcbm

21.7Mcbm

19.8Mcbm

18.1Mcbm

17.6Mcbm

16.7Mcbm

13.2Mcbm

13.1Mcbm

As can be seen in this list, based on total capacity, the biggest players are located in China with Sinopec, CNPC and PetroChina, followed by US with Kinder Morgan, Buckeye, Marathon, Enterprise and Magellan and Europe with Vopak and Oiltanking. With a combined total capacity of 223Mcbm, the top 10 players cover around 21% of the total capacity globally.

A bit more details on the three biggest storage operators

Sinopec Group, Chinese dragon at the top of the food chain

Sinopec Group, China Petroleum and Chemical Corporation, is a Chinese energy company based in Beijing (China). It is the second largest oil producing company after PetroChina. Besides 50 terminals (with a total storage capacity of 44Mcbm, mostly located in China) and 30.000 petrol stations, this company operates dozens of refineries, around half of the Chinese refinery capacity. Sinopec has various listings on stocks exchanges but for the majority the shares remains in the hands of the Chinese government. In 2017, total revenues was around €300 billion.

Vopak, Dutch giant with a global storage print

Vopak is an independent storage player with a long history dating back to the early 16the century. Independent means it does not own the oil products its stores. It therefor holds an independent position in the market unlike for instance Sinopec and CNPC, the number 1 and 3 in the list. The 69 terminals of Vopak are scattered around the globe. It has locations in more than 20 countries with largest concentration of terminals in the Netherlands, followed by China and the US. In 2018, Vopak’s revenues lay at €1.25 billion.

China National Petroleum Corp, a powerful energy emperor

CNPC is a one of the biggest vertical integrated oil companies in the world. Its origins date back to 1949 when communist China was formed. The company rose from Ministry of Petroleum which secured and managed the country’s fuel. It operates oil assets in more than 30 countries, except for the 24 storage terminals (with a total capacity of 25.7Mcbm) which are mainly located in the Chinese homeland. In the downstream area it also operates more than 20.000 petrol stations.

Are storage capacity market shares equal across the globe’s regions?

Is the global division of market shares similar for the different regions? Absolutely not. Let us analyze the regions with the largest concentration of terminals. The regions with the most terminals are the United States (1.447), Europe (1,125) and Asia (1.057).

In the United States, the tank storage is dominated by publicly owned storage operators with US origins. The top three consist of 1) Kinder Morgan, 2) Magellan and 3) Buckeye. The remainder of the top 10 consists only out of US-born tank storage players.

In Europe, the top 3 biggest players are 1) Vopak, 2) Oiltanking and 3) CLH. These companies are also publicly owned and have a broad international coverage which means they have a global storage footprint. For instance Vopak is ranked number 6 in Asia and Oiltanking is ranked number 12 in Asia.

In Asia the top 3 consist solely of Chinese state-owned companies: 1) Sinopec, 2) CNPC and 3) PetroChina. Their number four is a Japanese company, JX Nippon Corporation and the number five as the Korean Gas Corporation. As mentioned before, ranked six is Vopak.

As can be concluded, the global players take a large piece of the pie. However, there is enough room for other tank terminal players to operate a sustainable business in specific regions, countries or ports. Furthermore, the competitive dynamics differ per region, so tank terminal players face different opponents in various regions.

The data for this article was gathered with the support of TankTerminals.com’s database platform. With only a few clicks and couple of seconds the information of the biggest market players in the various regions was obtained.

Request A Sample

For several years, Insights Global has published market outlook reports on oil products for the ARA region. This report has been revised on a year-on-year basis.

As from 2018, we have produced new market outlook reports, now covering ARA & chemical products and Singapore & oil products. Our intention is to cover all major trading hubs for both research areas.

In this registration form, you are able to select the trading hub and research area of interest. Just fill in your name and e-mail address. You can make multiple selections. We will sent over a sample report and contact you shortly.

Driving Market Variables

A tank terminal can have various functions for its clients. A tank terminal can be needed for logistical purposes, as a trading platform and for strategic storage purposes. In ARA they are likely to have a combination of these functions.

Depending on market circumstances a terminal that functions excellent in certain high value segments can ask premium storage rates and will find enough demand to rent out its tank capacity.

However, markets change and this can alter clients’ requirements and shift profit potential and demand between market segments. To identify which and how market variables influence commercial circumstances for tank terminals, storage players need to be in sync with their environment.

Register For Your Download

Request Market Report Trial

7. Gas Oil in Backwardation

To ensure our market intelligence reporting meets and exceeds your business requirements before purchase, you are able to request a free 30 day trial.

Just leave your contact-details in the registration form below.

Note: we reserve the right to deny or withdraw trials for invalid details.

Investment Dynamics Per Hub

In the world, there are considered to be four major oil trading hubs: ARA, Houston, Singapore, Fujairah. These four port areas have their own different identity and their own local trading dynamics. In this high level research, we will compare investment intensity in these locations. For comparison purposes in ARA, we have split ARA in only Rotterdam and Antwerp.

In these 5 ports combined there are 146 terminal companies active. Most of the companies are situated in Houston (53), followed by Rotterdam (31), Antwerp (24), Singapore (21) and Fujairah (17). Looking at the capacity, these ports sum up to 76.35Mcbm. Most capacity is available in Houston (25Mcbm), followed by Rotterdam (19Mcbm), Singapore (15.28Mcbm), Fujairah (9.35Mcbm) and Antwerp (7.65Mcbm).

When we divided total storage capacity with the number of terminals we can calculate the average capacity per terminal. Biggest average tank size is in Singapore (0.73Mcbm), followed by Rotterdam (0.62Mcbm), Fujairah (0.55Mcbm), Houston (0.47Mcbm) and Antwerp (0.32Mcbm).

This calculation says something about the local storage footprint and the port’s specialty. For instance, Singapore is an Asian bunker hub which facilitates fuel oil storage. There are a number of big underground caverns there. Antwerp is focused on specialty chemical storage which need smaller tank sizes and lower average storage capacity per terminal.

For these five port areas, it is believed that around 22 expansions projects (existing greenfield, brownfield and planned additions) will add almost 8Mcbm to current capacity. Fujairah has 7 projects, followed by Houston (6), Antwerp (5), Singapore (3) and Rotterdam. Looking at the growth per capacity, port that shows the largest storage additions is Fujairah (29%), Antwerp (11%), Houston (9%), Rotterdam (7%) and Singapore (5%).

The conclusion of these statistics is that the major oil trading hubs have different strengths, serve a different purpose and show their own investment dynamics. Insights Global has presence at all these ports. We have the statistics and local knowledge to help investment companies value storage assets they would like to include in their investment portfolio.

Register For Your Download

Request Your ARA Stocks Trial

To ensure our market intelligence reporting meets and exceeds your business requirements before purchase, you are able to request a free 30 day trial.

Just leave your contact-details in the registration form below.

Note: we reserve the right to deny or withdraw trials for invalid details.

Relation barge flows & ARA stocks

Physical and futures oil trading companies struggle in getting a holistic view on the supply and demand balance of Northwest European oil markets. Changes in the S&D balance influence inventory levels and ultimately oil price movements. This incomplete picture results in sub-optimal market timing and more risks.

The Rhine Flow Service is the missing link in the ARA S&D puzzle as it captures oil products barge movements up and down the Rhine. Backtesting of Rhine Flow Service data in relation with ARA oil stock levels shows that there is a significant correlation between ARA stock levels and Rhine barge movements.

Register For Your Download

Request Your RFS Trial

banner-4

To ensure our market intelligence reporting meets and exceeds your business requirements before purchase, you are able to request a free 30 day trial.

Just leave your contact-details in the registration form below.

Note: we reserve the right to deny or withdraw trials for invalid details.