Is hydrogen the liquid bulk growth market of the future?

As governments worldwide are looking for ways to reduce their carbon footprint, hydrogen is often considered as an indispensable element in the energy transition. The importance of fossil fuels as the primary energy source for the global economy is expected to dwindle in the coming decades. Is hydrogen the perfect candidate to take their place?

As governments worldwide are looking for ways to reduce their carbon footprint, hydrogen is often considered an indispensable element in the energy transition. The importance of fossil fuels as the primary energy source for the global economy is expected to dwindle in the coming decades. Is hydrogen the perfect candidate to become the liquid bulk of the future?

As renewable energy is getting cheaper to produce thanks to advances in solar panel and wind turbine development, the ‘missing links’ in the transition to renewables are energy distribution and storage. While solar and wind can, in theory, easily meet all our energy needs, it’s not always sunny or windy outside – without a suitable energy carrier, matching supply and demand is practically impossible.

Hype or hope?

On paper, hydrogen is very well suited as an energy carrier. It’s not only the most abundant element in our universe but is also easy to combust, can be electrolyzed from water, and does not produce any harmful waste when combusted. Furthermore, compared to batteries, the energy density (MJ/kg) of hydrogen is much higher, meaning it can produce more power with less weight.

It’s therefore hardly surprising that many industries see hydrogen as an important growth market for the future. Mostly oil and chemical companies, which have a lot of the required infrastructure for distributing and converting gas and liquids already in place, consider hydrogen as an integral part of their future.

Does that mean hydrogen is the growth market of the future, replacing fossil fuels like diesel, gasoline, and kerosene? Well, it depends.

Over the past few decades, hydrogen-powered electric propulsion promised to be the perfect replacement for fossil fuel combustion engines in cars and trucks. Since both the car industry and fuel industry had ample experience with gas and liquid fuels, switching from petrol and diesel to hydrogen seemed relatively straightforward. However, over the past few years, considerable developments in lithium battery technology have upended this belief drastically.

If we look at the so-called ‘well-to-wheel’ efficiency, the difference between hydrogen-powered and battery-powered vehicles is quite dramatic. While ‘tank-to-wheel’ efficiency tells you how efficiently an engine turns fuel into movement (the traditional ‘miles per gallon’ metric), ‘well-to-wheel’ efficiency adds the energy it took to get that fuel to the gas tank or battery. Whereas the ‘well-to-wheel’ efficiency of hydrogen-powered is significantly better than the ‘well-to-wheel’ efficiency of a petrol fuel car (22% vs. 13%), battery-powered vehicles on average have a ‘well-to-wheel’ efficiency of 73%.

The main reason for this difference in efficiency is the required extra steps to convert electricity into forward motion. Hydrogen first needs to be produced through electrolysis at a production plant, only to be converted back into electricity in the car to power the electric motor.

Storing and distributing hydrogen also comes with a set of challenges. Storage of hydrogen as a gas typically requires high-pressure tanks (350–700 bar or 5,000–10,000 psi tank pressure). Hydrogen can also be stored as a liquid, but considering the boiling point of hydrogen at one-atmosphere pressure is −252.8°C, this requires cryogenic temperatures. In short, this means that both storing hydrogen as a gas or a liquid requires large amounts of energy, as the hydrogen needs to be pressurized or cooled, respectively. 

A promise unfulfilled?

Does this mean hydrogen has no place in our ongoing energy transition? No, not at all. While hydrogen might not be as suited as fuel for cars as it once was thought, it still has a lot of potential as an energy carrier in industrial applications. 

Over the past years, the proportion of renewable energies has proliferated. Wind power and solar energy have seen the most significant increase. However, because the wind doesn’t always blow, and the sun doesn’t always shine, the availability of these so-called variable renewable energies (VREs) fluctuates over time. Simultaneously, because of how power grids work, supplying electricity requires a constant balancing of supply and demand.

As the proportion of renewable energies keeps growing, additional measures are necessary to integrate fluctuating renewable energy supplies. Because of its relatively straightforward production and abundance, hydrogen is very suitable to store energy production peaks from solar and wind, thus balancing energy supply and demand.

Bulk storage

Balancing the energy production of variable renewable energies will require large amounts of hydrogen storage capacity. Can we leverage our current liquid bulk storage capacity for this herculean task? The most important hydrogen storage methods are physical storage methods based on either compression or cooling or a combination of the two (hybrid storage). As mentioned before, hydrogen is typically stored in high-pressure tanks. Higher storage density comes at a price, however. The higher the storage density, the greater the amount of energy needed for cooling and compression, and the more complex the design of tank systems and infrastructure. Because of the extreme high pressures, converting current liquid bulk storage assets will most likely not be feasible.

In addition to physical storage methods, a large number of other new, material-based hydrogen storage technologies are being developed. These materials-based storage technologies can include solids, liquids, or surfaces. While most of these techniques are still in their infancy, materials-based storage technologies promise to solve many of our current issues with hydrogen storage. For tank terminals, liquid organic hydrogen carriers (LOHCs) represent an especially interesting option. By binding hydrogen chemically in organic compounds like, for instance, methanol and ammonia, these liquids act as a chemical battery for storing hydrogen molecules.

Stay up-to-date on hydrogen storage as a growth market

As liquid bulk terminals are specifically designed for handling such liquid organic compounds, the tank terminal industry will keep a keen eye on these storage technologies.

The developments in the ongoing energy transition and its impact on the fuel market make it crystal clear that hydrogen should be on the radar for every tank terminal operator. During our regular Market Update webinars, we offer our expert outlook on short-term supply, demand, and trade flows and look ahead to future developments and new technologies.


Impact of OPEC+ conflict and COVID-19 on Tank Storage Demand in Main Oil Hubs (part 3)

Recap second quarter 2020

FROM THE TANKER VISITS AND MARINEGROSS TRADE OF TERMINALS WITH WATER ACCESS, IT WAS CONCLUDED THAT, DUE THE COVID-19 PANDEMIC, DEMAND FOR FUELS HAD BEEN SEVERELY WEAKENED. THIS RESULTED IN LESS PRODUCT BEING MOVED TO AND FROM TERMINALS, AND THE TREND THAT WAS ALREADY VISIBLE IN THE FIRST QUARTER OF 2020 EVEN ACCELERATED IN THE SECOND QUARTER OF 2020. INTELLIGENT LOCKDOWNS, CLOSED BORDERS AND OTHER PREVENTIVE MEASURES IN ALL MAJOR HUBS WEIGHED ON FUEL CONSUMPTION AND INTERNATIONAL TRADE FLOWS.

THE COVID-19 PANDEMIC AND THE SHORT-TERM SUPER CONTANGO HAD A HUGE IMPACT ON FUEL DEMAND, TRADE FLOWS AND STORAGE DEMAND, COINCIDING FOR ALL TRADING HUBS. STATISTICS SHOWED THE VIRUS WAS LONG FROM DEFEATED AND IF COUNTRIES DID NOT TAKE IMMEDIATE PREVENTIVE ACTIONS A SECOND WAVE WAS EXPECTED TOWARDS THE END OF THE YEAR. THIS WOULD MEAN THAT CURRENT MARKET DYNAMICS WILL PERSIST FOR THIS YEAR.

Key highlights third quarter

  • Tanker visits in the third quarter dropped to their lowest value in three years but the decrease was less than in prior quarter
  • Like the number tanker visits, marine gross trade volumes in the third quarter also fell to their lowest value in three years. Again, the rate of decline was not as strong as in 2Q20
  • Berth occupancy rates in the third quarter showed a modest uptick
  • Total stocks in the hubs are declining in the third quarter with tanker visits are gradually increasing in the last part of 3Q20

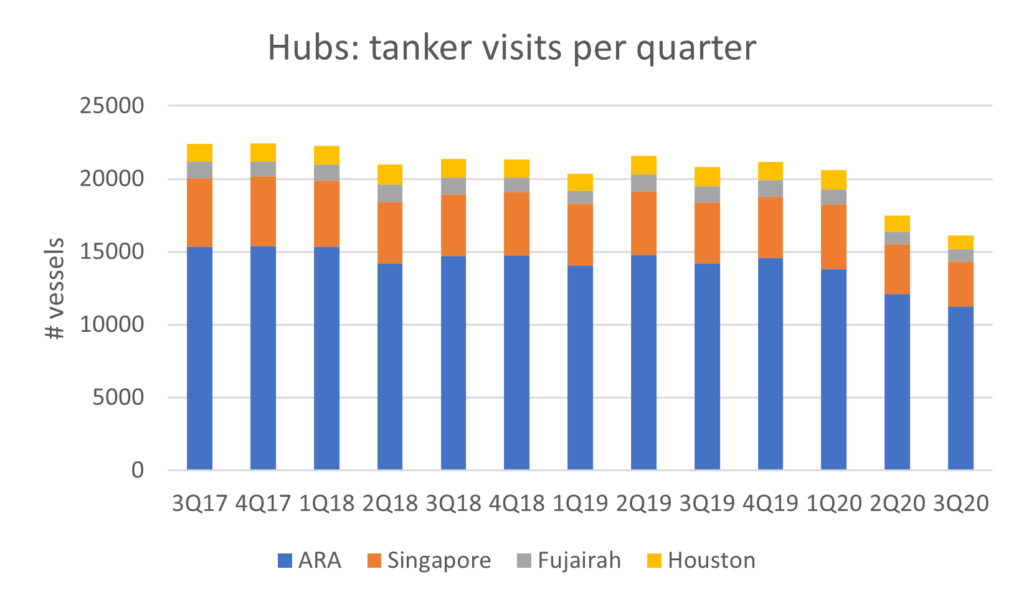
Tanker Visits Per Hub Per Quarter

Looking at all oil tanker visits per hub combined in the graph below, we see that the total number has fallen from the second quarter to third quarter with 8% to 16,126 tanker visits. Comparing the third quarter of this year with the third quarter last year, there is even a 22% decline visible. With the exception of Fujairah, which showed its second lowest value, all hubs in the third quarter showed their lowest value in three years. In the ARA, the number of tanker visits fell from 12,124 to 11,254 which is a 7% decline q-o-q. Comparing y-o-y, tanker visits in Europe’s main hub decreased by 21%. In the Asian hub, Singapore, the number of tanker visits fell from 3,393 to 3,072. That is a 27% decline y-o-y and a 9% decline q-o-q. Houston showed, with 937 tanker visits, the largest drop, q-o-q with 15% and y-o-y with 29%. As stated before, Fujairah, with 863 tanker visits, showed its second lowest value in the third quarter. On a quarterly basis, tanker visits rose by 1% while on yearly basis, tanker visits dropped with 22%. Looking at the consolidated numbers of the hubs, we see that pace of decline is slowing. From 1Q20 to 2Q20, the number of ship visits fell from 20,586 to 17,474 or 15% while from 2Q20 to 3Q20, we saw a 8% decline. The slower pace of decline is mostly the result that as from mid-August the number of oil tanker visits started to improve modestly.

Figure 1: Tanker visits per hub per quarter; source TankTerminals.com

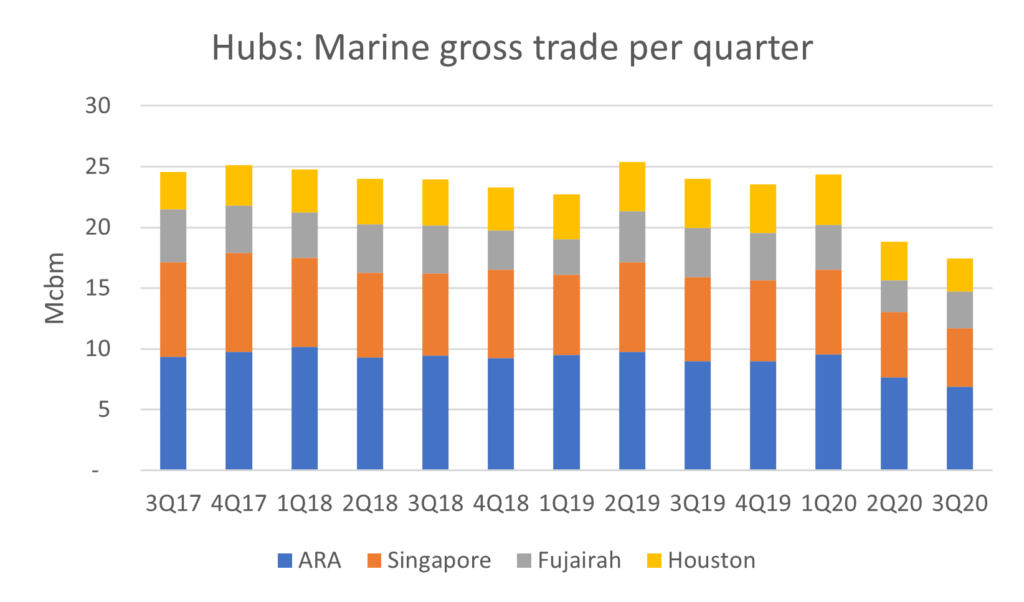
Marine Gross Trade Per Hub Per Quarter

The marine gross trade numbers show a similar pattern in relation to the tanker visits. For all hubs combined the marine gross trade figures dropped from 18.8Mcbm in the second quarter of 2020 to 17.4Mcbm in the third quarter of 2020, reflecting a decline of 7%. On yearly basis, comparing 3Q19 with 3Q20 marine gross trade numbers shaved some 23%. Again the value of 3Q20 was the lowest value in three years’ time and  this applied for all hubs with the exception of Fujairah. In the ARA region, marine gross trade volume edged 10% lower on quarterly base to 6.9Mcbm and 24% lower on a yearly base. In Singapore, marine gross trade volumes decreased by 10% to 4.8Mcbm q-o-q while in Asia the volumes dropped with  30% year-on-year. In Fujairah volumes in the third quarter were 3Mcbm compared to 2.6Mcbm in the second quarter. That is a 14% build q-o-q but on a yearly basis it is still 25% lower. Houston showed the largest drop quarter-on-quarter (14%) and year-on-year (33%). The marine gross trade volume in the third quarter stood at 2.7Mcbm.

Figure 2: Marine gross trade per hub per quarter; source TankTerminals.com

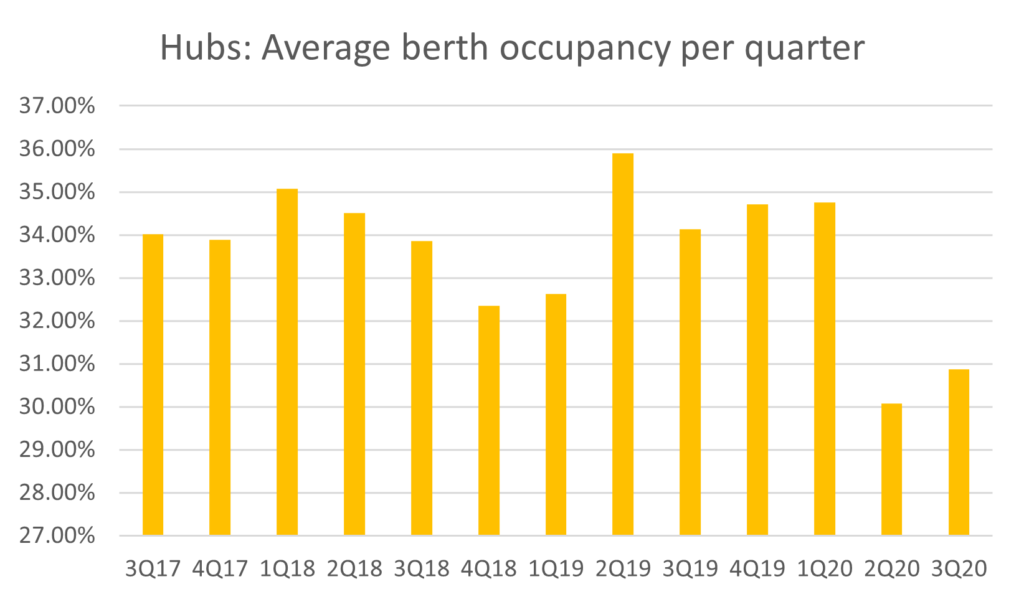
Berth Occupancy Per Hub Per Quarter

With the exception of Houston, similar patterns were seen for ARA, Singapore and Fujairah when looking at the average berth occupancy of the local marine terminals. The berth occupancies at these hubs still stood at their second lowest value since 2017 but showed a minor uptick compared to the second quarter of this year. The berth occupancy rate for all hubs combined rose from an occupancy of almost 30% to almost 31%. In the ARA region, average berth occupancy rates rose from 31% to almost 31.5% in the third quarter. In Singapore, average berth occupancy rates grew from 29.5% to 30% while in Fujairah, occupancy rates jumped from 29.5% to 32.2%, making it the biggest mover. Berth occupancy rates in Houston fell from 30.3% to 29.7%.

Figure 3: Average berth occupancy per quarter; source TankTerminals.com

Stock numbers versus tanker visits

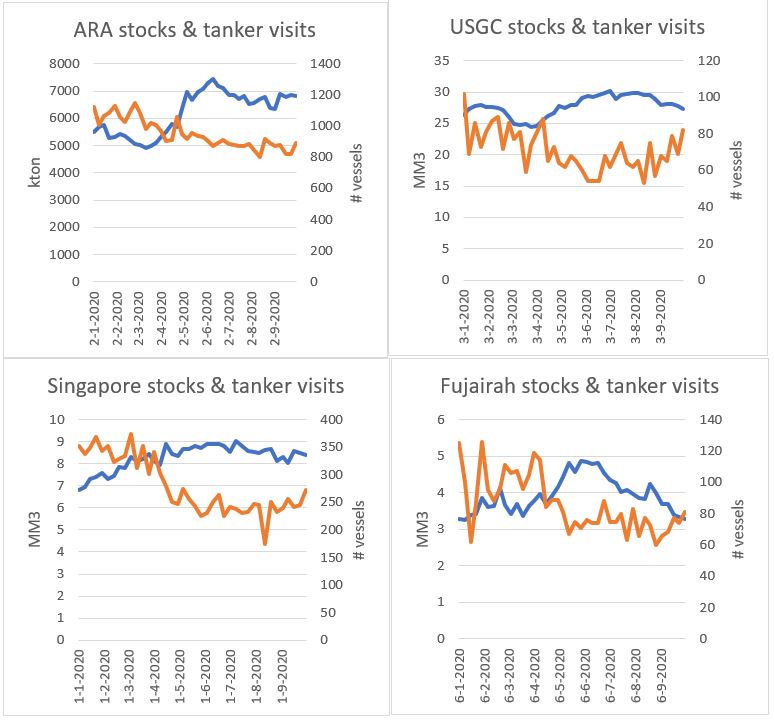
Total stocks combined (including light ends, middle distillates and heavy end stocks) showed similar patterns like the number of tanker visits as already explained. It seems that in most trading hubs total stocks peaked around the middle of the year (June) and then started a modest descent in the third quarter. The rise in stocks was a combination of fuel demand destruction and the presence of the super contango due to the impact of COVID-19. The number of tanker visits shows a contradictive pattern, with the number of visits kind of bottoming out as from the middle of the year.

Figure 4: ARA stock levels and tanker visits; source TankTerminals.com

Conclusion

The number of tanker visits in the third quarter of this year kept decreasing for all primary trading hubs. However, the pace of decline was less strong than in the second quarter. The weaker contraction rate came from a recovery of ship movements in the last four weeks of the quarter. The same pattern was visible for marine gross trade volumes. Average berth occupancy rates for all hubs showed a modest increase. These developments combined with lower stocks indicate that the easing of the COVID-19 lockdown measurements during the summer period have supported trading and shipping dynamics at global trading hubs.

So although fuel demand remained very weak some indications of improvement were visible. Worrying is that in September the numbers of Corona infectious globally started to rise again. This situation led most countries to undo the relief of restrictive measures. In these countries harsh actions have been introduced to further limit travel movements and social contacts of people. Obviously this will lead to less fuel demand in the transport industry and thus less trading and business activity at the terminals.

It is expected that, with a continuation of the restrictive measures in the world well into December and January, the number of tanker visits and marine gross trade volumes remain depressed. Recovery will go hand in hand with the introduction of a vaccine. However, expectations are that numbers and volumes will still not be on the level as before the Corona pandemic.

About the authors and the data

The data in this report was extracted from the Tankterminals.com database and Insights Global’s weekly ARA Oil Product Levels publication. The data in Tankterminals.com came specifically from the Logistical Performance Benchmarking addon, which uncovers information on certain terminal performance indicators such as occupancy rates and turnaround times at berth level of a terminal. To analyze the hubs, all the berth data from the various terminals located in these specific hubs was aggregated and offered these unique insights. Tankterminals.com has data on the logistical performance dating back till the third quarter of 2017. Insights Global’s weekly ARA Oil Product Levels publication is a well-established report in the international oil trading business. Insights Global has data going back to 1995.

Jacob van den Berge has been working for Insights Global for more than 8 years and has 10 years of experience in the oil & gas industry. Currently he is the Head of Marketing and Sales but used to work as an oil market analyst and industry consultant for the company.

Contact Insights Global if you would like to discuss how our data driven company can add value to your organization by enabling intelligent decisions.

Having access to accurate, up-to-date oil storage rates is crucial to make the right business decisions.

With our Global Oil Storage Rate Report, you’ll gain access to the single and only authoritative source of storage rate information available worldwide. It will provide you with transparency on price levels in global tank storage markets regularly, so you are always in the know and can set the right ask and bid prices for your storage.

Download your FREE Sample Report now and discover what information you could have at your fingertips each quarter.

5 Reasons you should invest in a tank terminal

Is investing in a tank terminal something you should consider? While in most cases the answer will be a sounding ‘yes,’ it will pay dividends to first learn more about the exciting world of tank terminals. Let’s take a look at the top 5 reasons why you should invest in a tank terminal.

We often see investors flocking to lower-risk investments during economic uncertainty, such as government bonds, real estate, and infrastructure. Therefore, it’s hardly surprising that we are seeing a significant uptick in interest for tank terminals investments.

Is investing in a tank terminal also something you should consider? While in most cases the answer will be a sounding ‘yes,’ it will pay dividends to first learn more about the exciting world of tank terminals. Let’s take a look at the top 5 reasons why you should invest in a tank terminal.

1. Tank terminals have typically always been a very profitable industry, with high return of investments and a low-risk profile

When we take a look at the profitability of tank storage companies over the past decades, they show in general very positive numbers. For example, Vopak, the worldwide market leader in tank terminals, has consistently demonstrated high EBITDA and EBIT percentages over the last 15 years; an excellent track record that most companies from other sectors can only dream of.

2. Tank terminals benefit from gross trade and product imbalances

As our national economies become more intertwined, gross trade keeps growing consistently. For some sectors, this increased gross trade and consequent product imbalances cause challenges. Because tank terminals are key in facilitating gross trade and correcting product imbalances, an increase in gross trade actually presents new business opportunities.

3. By using tank terminals as ‘forward stocking’ locations, products owners can save a considerable amount of supply chains costs

Tank terminals are not just about storage; smart product owners know that they can also leverage them as forward stocking locations.

Let’s say there is a South African refinery that has contracts in place with 20 European customers, selling them 10 tons of product per year each. The refinery could choose to ship 20 times 10t of product from South Africa to its individual customers in Europe. However, a smart product owner will ship the 200t of products to Europe in a single load, rent a tank in the region, and distribute the product when the customers need it. The cost advantage of the second option is huge; keep in mind that vessel costs are much higher than storage costs.

As pressure on supply chains to become more efficient is constantly rising, this forward stocking function of terminals will only become more important in the future.

4. As GDP is expected to keep on growing, it is also likely that gross trade keeps on growing

Historically speaking, there has always been a strong correlation between GDP and gross trade. If we take chemicals as an example, we have seen that historical chemical consumption growth percentages routinely exceed the GDP growth percentages. The main reason is that chemicals are heavily integrated into our daily lives and that chemicals have replaced other materials like wood, steel, paper, and glass.

5. Tank terminals are part of the supply chain of different value chains, like oil, gas, chemicals, and vegetable oils.

The location of a terminal is a very critical factor in determining the attractiveness of a terminal; if a terminal is located close to the sea is on average more attractive compared to more inland located terminals, as it saves time from marine vessels’ perspective and larger vessels can access the terminal.

What’s next?

These top 5 reasons are just the start. To become a successful investor in the tank terminal industry, there is still much more to learn. 

Download our whitepaper “What you must know before investing in tank terminals.”

5 biggest pitfalls to burn money in tank terminal investments

The tank terminal market is very fragmented, with more than a thousand terminal operators and five thousand terminals worldwide. Furthermore, the market dynamics these terminals operate within can be quite complex, making it hard for investors to assess the true value of a prospective asset. In this blog, we’d like to present you with the 5 biggest pitfalls to burn money in terminal investments.

Tank terminals are considered infrastructure assets with a low-risk profile that generate stable revenue streams. Therefore, it’s hardly surprising that we see a significant uptick in interest for tank terminals investments during these uncertain economic times.However, we have also seen even seasoned investors getting lost in the world of tank terminals.

The tank terminal market is very fragmented, with more than a thousand terminal operators and five thousand terminals worldwide. Furthermore, the market dynamics these terminals operate within can be quite complex, making it hard for investors to assess the true value of a prospective asset.

In this blog, we’d like to present you with the 5 biggest pitfalls to burn money in terminal investments. 

1. Lacking knowledge

When assessing the market worth for a tank terminal, only looking at the bottom line will not be enough. Competitive value comes from collecting and understanding data on a terminal’s location, infrastructure, activity level, et cetera. 

That’s why it’s key to get access to industry-specific knowledge and get a complete picture of the asset you are interested in.

2. Paying a price which is too high

Given the complexity and dynamic of the Tank terminal industry, make sure you have a solid understanding of the key performance indicators of the terminal. What are the throughput levels? What are excess throughput levels? How are contracts being structured? What are the occupancy rates of the jetties?

Only if and when you partner with an advisor who understands the industry and will provide you with the essential and detailed insights, you can build your investment case and valuation model, minimizing the risk of bidding too high.

3. Lacking an exit plan

Even though this is true for all sorts of investments, you’ll need to pair a sound investment plan with a solid divestment strategy. Knowing when to sell is just as valuable as knowing when to buy. When market dynamics are changing and divestment of your assets is the smart move to make, a solid exit strategy is invaluable when it’s time to act.

4. Low probability of winning the bid

Being a successful investor is not only about being able to identify a good investment opportunity; it’s also about knowing when to pass on a bid. 

If there is too much competition or if you expect you will be willing to pay the expected price, it is better to exit the process at an early stage. By using a phased approach, you’ll never end up investing a tremendous amount of time and money on a bid that would never be successful.

5. Expecting high returns for low-risk investment

You can’t have your cake and eat it, too. While investments in infrastructure assets like storage terminals are often a great addition to your investment portfolio, be sure to have realistic expectations of your return on investment. While it may seem a bit ‘boring’ in the world of stock shorting, high-frequency trading and venture capital, investing in tank terminals is considered a low-risk investment with respectable returns.

What’s next?

Now you know what you shouldn’t do, you might want to know what you should do to become a successful investor in the tank terminal industry. 

Download our whitepaper “What you must know before investing in tank terminals.”

Impact OPEC+ conflict and COVID-19 on Tank Storage Demand in Main Oil Hubs (part 2)

Recap last quarter blog article

In the last blog article, we explored the impact of the super contango and COVID-19 on tank storage demand in the four major oil trading hubs Amsterdam-Rotterdam-Antwerp (ARA), Houston, Singapore, and United Arab Emirates (UAE).

We concluded that the main trading hubs showed similar patterns by looking at the statistics of tanker visit numbers, marine gross trade and average berth occupancy rates, especially in the first quarter of 2020 in which the defining events OPEC+ conflict and COVID-19 evolved.

We said that in the first quarter of 2020 the number of tanker visits of the different hubs was at a minimum while the average berth occupancy rates were at their second highest since the third quarter of 2017. The low number of tanker visits was likely to have been caused by 1) high fill rate or almost full tanks of terminal operators due to contango storage play options and 2) lower consumption levels due to demand destruction by COVID-19.

The high berth occupancy rates can be explained by the fact that, despite the low number of tanker visits, in the first quarter of 2020 terminal operators were coping with the impact of IMO legislation to their business operations which might have resulted in a bit slower vessel handling at the terminals.

In this blog article we will focus on the second quarter of this year when the pandemic – in certain areas –  was at its height. We will analyze what the impact of the super contango and COVID-19 had on tank storage demand in the major trading hubs has been, individually and combined.

Tanker Hub Visits Per Quarter

For all trading hubs consolidated the number of tanker visits dropped to a new low in the second quarter of 2020, with 13% less tanker visits compared to the previous quarter and even 19% less tank visits compared to the same quarter a year ago. Looking at the tanker visits trend (figure 1), all trading hubs show a similar trend with a continuation of the downward trend in 2020. For all hubs, with the exception of Fujairah, in the second quarter of this year the minimum value of tanker visits was reached since the third quarter of 2017. For Fujairah it was the second lowest number. The 2Q20 value for ARA was 12,184 tanker visits which is 10% lower q-o-q and 18% lower y-o-y. Singapore showed the strongest decrease in comparison with the other hubs. In the second quarter of 2020, the Asian port registered 20% less tanker visits in comparison with the first quarter of the year. The value for 2Q20 was 3,305. In relation with last year’s second quarter, the number of tanker visits was reduced with almost a quarter. In Fujairah there were 893 tanker visits seen in the second quarter of 2020. That was 19% lower than last quarter and 23% lower than the second quarter of 2019. The lowest value in Fujairah was 878 tanker visits in the first quarter of 2019. Houston registered 999 tanker visits in 2Q20. That meant 20% less tanker visits q-o-q and 22% less tanker visits y-o-y.

Figure 1: Tanker visits per hub per quarter; source TankTerminals.com

Marine Gross Trade Per Hub Per Quarter

With respect to marine gross trade volumes we see a striking resemblance in the trend of the major trading hubs (figure 2). For all the hubs, it applies that marine gross trade in the second quarter of this year was at its lowest since late 2017. The 2Q20 value in ARA was 7.7Mcbm while its average volume over the last 12 quarters was 9.3Mcbm. That is a 15% drop since last quarter and a 21% drop since last year. In Singapore, the 2Q20 value stands at 5.5Mcbm while the average numbers stands at 6.9Mcbm. This is a 16% decrease q-o-q and a 25% decrease y-o-y. In Fujairah these numbers are even more substantial. The minimum value in 2Q20 was 2.4Mcbm and the average value was 3.6Mcbm. The drop compared to last quarter was 31% and compared to last year even 41%. Houston numbers stood at 2.8Mcbm in the second quarter while the average stood at 3.6Mcbm. This means a q-o-q decrease of 26% and 30% y-o-y. For the hubs combined, we saw 20% drop q-o-q and 27% drop y-o-y.

Figure 2: Marine gross trade per hub per quarter; source TankTerminals.com

Berth Occupancy Per Hub Per Quarter

All major trading hubs showed a similar trend in berth occupancy rates in the second quarter of this year (figure 3). The rates showed a decrease compared to the last quarter while for ARA, Singapore and Houston the berth occupancy rates were at their lowest since the third quarter of 2017. For Fujairah, berth occupancy rates showed their third lowest value. The average berth occupancy in the ARA stands at around 32% while 2Q20 value stands at 31%. In Singapore and Houston these values are even more dramatic with an average berth occupancy of both hubs at 33% while the value in the 2Q20 was just below 30%. In Fujairah the average berth occupancy stands at 35.5% and the 2Q20 number was 32%. For the hubs combined we saw an average berth occupancy value of almost 31% (minimum) in the second quarter while the average stood at 33.5%.

Figure 3: Average berth occupancy per quarter; source TankTerminals.com

Stock numbers versus tanker visits

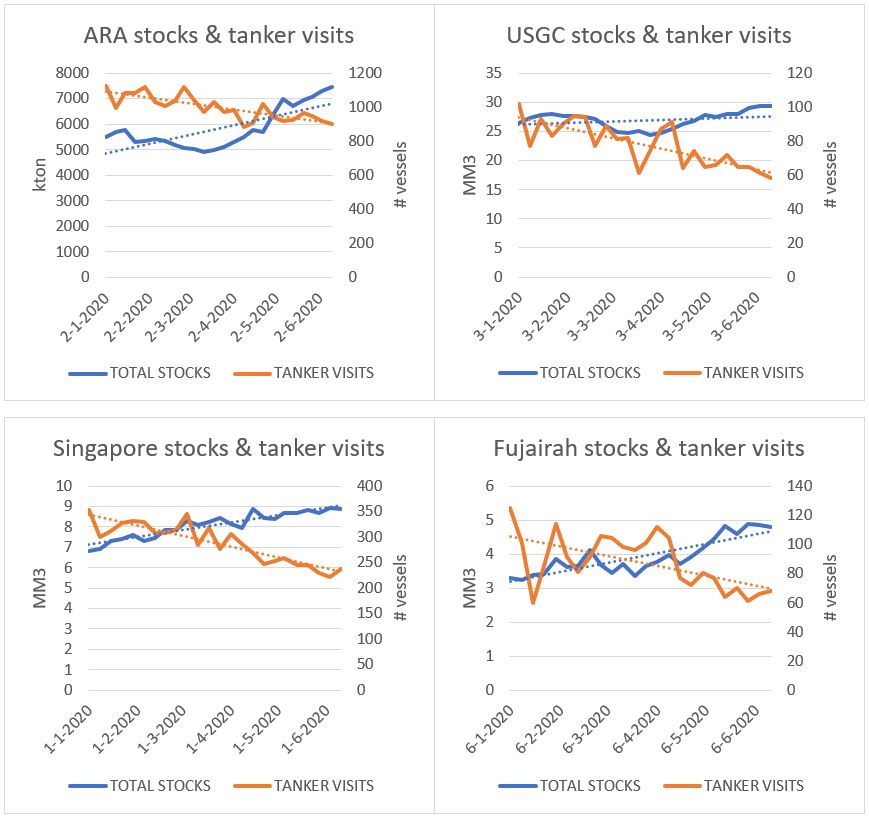
For all major hubs light end, middle distillates and heavy end stocks combined have been building this year (figure 4). The growth rate for the hubs is different but stock levels show a similar pattern and that is an upward trend. The same relation is visible for the tanker visits although a negative trend as the number of tanker visits for all hubs have been declining.

Figure 4: ARA stock levels and tanker visits; source TankTerminals.com

Conclusion

Especially for the tanker visits and marine gross trade of marine terminals it can be concluded that due the COVID-19 pandemic demand for fuels has been severely weakened which resulted in less product being moved to and from terminals. This trend was already visible in the first quarter of 2020 but accelerated in the second quarter of 2020. Intelligent lockdown, closed borders and other preventive measures in all major hubs weighed on fuel consumption and international trade flows.

The lower demand and forthcoming less international transports also led to a rise of consolidated oil product stocks in all major trading hubs. Besides less oil consumption, oil product terminals profited from the super contango which resulted in an additional build of oil product stocks. As the charts in figure 4 show, stock levels rose in 2020 while the number of tanker visits dropped. It is striking to see that all hubs show similar trends.

Berth occupancies in all hubs on the other hand dropped to their lowest since Insights Global started gathering data of terminals’ logistical performance. Also this change has been related to the COVID-19 pandemic impact. We concluded that berth occupancies rose as from the first quarter of 2019 till the first quarter of 2020 due to less efficient vessel handling operations at terminals in the run up to implementation of IMO2020 legislation. We see now that lesser ships handled by the terminals due to COVID-19 destructive demand impact weighed on terminals’ berth occupancy rates.

In general it can be concluded that the COVID-19 pandemic and the short term super contango had a hug impact on fuel demand, trade flows and storage demand, coinciding for all trading hubs. As current statistics show the virus is long from defeated and if countries do not take immediate preventive actions a second wave can be expected on the short term. This would mean that current market dynamics will persist for this and upcoming years.

About the authors and the data

The data in this report was extracted from tankterminals.com database and Insights Global’s weekly ARA Oil Product Levels publication. The data in tankterminals.com came specifically from the logistical performance benchmarking addon, which uncovers information on certain terminal performance indicators such as occupancy rates and turnaround times at berth level of a terminal. To analyze the hubs, all the berth data from the various terminals located in these specific hubs was aggregated and offered these unique insights. Tankterminals.com has data on the logistical performance dating back till the third quarter of 2017. Insights Global’s weekly ARA Oil Product Levels publication is a well-established report in the international oil trading business. Insights Global has data going back to 1995.

Jacob van den Berge has been working for Insights Global for more than 8 years and has 10 years of experience in the oil & gas industry. Currently he is the Head of Marketing and Sales but used to work as an oil market analyst and industry consultant for the company.

Contact Jacob van den Berge if you would like to discuss how our data driven company can add value to your organization by enabling intelligent decisions.

Having access to accurate, up-to-date oil storage rates is crucial to make the right business decisions.

With our Global Oil Storage Rate Report, you’ll gain access to the single and only authoritative source of storage rate information available worldwide. It will provide you with transparency on price levels in global tank storage markets regularly, so you are always in the know and can set the right ask and bid prices for your storage.

Download your FREE Sample Report now and discover what information you could have at your fingertips each quarter.

Changing biofuels regulation and the impact on terminals

The biofuel component in gasoline and diesel has been increasing slowly but surely since 2003, but changing biofuels regulation over the next few years are set to have a strong impact on tank terminals.

Tank terminals have been instrumental in facilitating the rising popularity of biofuels in the European Union. The first EU biofuels directive—to promote the use of biofuels and other renewable fuels for transport—entered into force in 2003 and set a voluntary blending target of 2% in 2005. The biofuel component in gasoline and diesel has been increasing slowly but surely since then, but changing biofuels regulation over the next few years are set to have a strong impact on tank terminals.

In November 2016, the European Commission published its ‘Clean Energy for all Europeans’ initiative. As part of this package, the Commission introduced an updated version of the Renewable Energy Directive, which defines a series of sustainability and GHG emission criteria for bioliquids. After the EU member states reached an agreement on this proposal in December 2018, the Renewable Energy Directive II (RED II) officially entered into force.

In RED II, the overall EU target for sustainable energy sources by 2030 has been set to 32%. While the Commission’s original proposal did not include a transport sub-target, the final agreement stipulates that the Member States must require fuel suppliers to supply a minimum of 14% of the energy consumed in road and rail transport by 2030 as renewable energy. Fuels used in the aviation and maritime sectors can opt in to contribute to the 14% transport target but are not subject to an obligation.

Currently, most member states are not meeting their individual targets. However, considering that the directive has to be transposed into national law by the Member States by 30 June 2021, the European Commission will soon be legally equipped to enforce the directive.

For tank terminals, this will mean a substantial shift in blending demand. Traditionally, bioethanol consumption depends on road gasoline consumption, which is expected to decrease. However, due to higher blending mandates, ethanol demand is expected to grow. Likewise, biodiesel consumption is strongly correlated to road diesel consumption.  Although diesel consumption is also expected to decrease, due to higher blending mandates we expect the demand for biodiesel to grow as well. The maximum percentage of first-generation biofuels is capped at 7%, while the rest should be an advanced / next-generation biofuel 

So while we expect the net demand for gasoline and diesel to decrease due to a variety of factors (economic recession, electrification of passenger cars and cargo vans, work-from-home), the higher blending mandates will create strong growth in demand for respectively bioethanol and biodiesel. This will offset the decline in fossil fuels and increase the demand for tank terminal blending for tank terminals.

The Renewable Energy Directive II and its impact on the fuel market make it crystal clear that biofuels should be on the radar for every tank terminal operator. During our regular Market Update webinars, we offer our expert outlook on supply, demand, and trade flows and its impact on tank storage demand.

Do you want to make sure that you never miss out on important market updates? Sign up for the next webinar today, so that you are better prepared for what tomorrow will bring.

Independent ARA Oil Product Stocks Fall

August 04, 2020 – Total oil products held in independent storage in the Amsterdam-Rotterdam-Antwerp (ARA) trading hub have fallen in the past week, reaching their lowest since the week to 30 April.

Low demand brought ARA product stocks to a record high during the week to 11 June, but inventory levels have fallen consistently since as demand recovers and products markets return to backwardation. Stocks of all surveyed products fell during the week to yesterday, with the exception of gasoline.

Gasoline inventories in ARA rose on the week. Shipments to the US increased, and gasoline cargoes also departed for Canada and west Africa. But this was more than offset by incoming cargoes from Finland, Italy, Sweden and the UK. An Aframax tanker that had been serving as gasoline floating storage since May also discharged in the area, adding to inventories. Gasoline blending component barge traffic around Amsterdam and the rest of the region was steady at a low level, with blending activity minimal with ample supplies.

Fuel oil stocks fell, reaching their lowest since 12 March. Fuel oil cargoes departed ARA for Saudi Arabia, west Africa and the Mediterranean, while cargoes arrived from France, Russia, the UK and Cuba. The Mareta carried a high sulphur fuel oil (HSFO) cargo from the area elsewhere in northwest Europe, in response to high supply in the ARA and relative tightness in northwest European HSFO supply.

ARA gasoil stocks fell on that week. High inventories at destinations along the Rhine continued to inhibit barge bookings from the ARA area to terminals inland. Barge flows from ARA to upper Rhine destinations held steady at around their lowest level since January. Gasoil cargoes departed ARA for the Mediterranean and the UK, and arrived from Russia. Inflows from Russia will remain at a low level during August.

Jet fuel inventories fell, after reaching fresh all-time highs in the previous five consecutive weeks. Demand from the aviation sector remained low, but appeared higher on the week and outflows to the UK rose. No tankers arrived carrying cargoes from elsewhere.

Naphtha inventories fell. The volume of naphtha departing the ARA area for inland Rhine destinations ticked down on the week, amid competition from rival petrochemical feedstocks. Naphtha cargoes arrived from the Mediterranean, Russia and the UK.

By Thomas Warner

Having access to accurate, up-to-date oil storage rates is crucial to make the right business decisions.

With our Global Oil Storage Rate Report, you’ll gain access to the single and only authoritative source of storage rate information available worldwide. It will provide you with transparency on price levels in global tank storage markets regularly, so you are always in the know and can set the right ask and bid prices for your storage.

Download your FREE Sample Report now and discover what information you could have at your fingertips each quarter.

Independent ARA Oil Product Stocks Rise on Week 30

July 28, 2020 – Total oil products held in independent storage in the Amsterdam-Rotterdam-Antwerp (ARA) trading hub have risen the past week, after falling to two-month lows in the previous week.

Stocks went up in the week to 22 July, but the overall increase masks contrasting moves across the different product groups surveyed. Fuel oil stocks rose after falling by around the same amount the previous week. No fuel oil cargoes departed ARA for either the Mideast Gulf or the key arbitrage market of Singapore, but cargoes did leave for the Mediterranean and west Africa. Fuel oil cargoes arrived in ARA from France, Norway, Russia, the UK and via ship-to-ship transfer off Skaw in Denmark.

ARA gasoil stocks fell on the week. High inventories at destinations along the Rhine continued to inhibit barge bookings from the ARA area to terminals inland. Barge flows from ARA to upper Rhine destinations reached their lowest level since January 2020, and the lack of activity weighed heavily on barge freight rates. Gasoil cargoes departed the ARA area for France, the Mediterranean and the UK, and arrived from Saudi Arabia and the US.

Gasoline inventories in ARA rose on the week. Shipments to the US increased, and gasoline cargoes also departed ARA for Canada and the Mediterranean. But this was more than offset by incoming cargoes from France, Latvia, Italy and the UK, and from floating storage in the North Sea. The gasoline held in North Sea floating storage has tended to discharge in Amsterdam when making its way back to onshore storage tanks. Gasoline-component barge traffic around Amsterdam and the rest of the region was notably low during the week to yesterday, with finished-grade gasoline still well-supplied in the region.

Naphtha inventories fell. A naphtha cargo departed ARA for Brazil, where it is likely to be used as a petrochemical feedstock at Braskem’s Camacari cracker. The volume of naphtha departing the ARA area for inland Rhine destinations also rose on the week, although demand from gasoline blenders remained low. Naphtha cargoes arrived from France and Norway.

Jet fuel inventories were the only surveyed product group to hit fresh all-time highs, for the fifth consecutive week. Stocks reached went up from the previous week. Demand from the aviation sector remained very low. A single jet fuel cargo arrived in the region having loaded via ship-to-ship transfer off Southwold in eastern England, and a tanker carrying jet fuel departed ARA for the UK.

By Thomas Warner

Having access to accurate, up-to-date oil storage rates is crucial to make the right business decisions.

With our Global Oil Storage Rate Report, you’ll gain access to the single and only authoritative source of storage rate information available worldwide. It will provide you with transparency on price levels in global tank storage markets regularly, so you are always in the know and can set the right ask and bid prices for your storage.

Download your FREE Sample Report now and discover what information you could have at your fingertips each quarter.

Covid-19 and the impact on the Market Outlook and Oil terminals

Even though the Covid-19 pandemic is still in full swing, it is safe to say that the corona-virus has had a profound impact on nearly every aspect of our daily lives. Besides the more visible effects on public health, society, and transportation, Covid-19 also sent a shockwave through the global economy. 

Even though the Covid-19 pandemic is still in full swing, it is safe to say that the corona-virus has had a profound impact on nearly every aspect of our daily lives. Besides the more visible effects on public health, society, and transportation, Covid-19 also sent a shockwave through the global economy. 

This economic shockwave also had its effects on tank terminals: As soon as the true scope of the Covid-19 pandemic became apparent, the oil market shifted from a backwardated market into a deep contango. Needless to say, this contango immediately led to a significant increase in demand for tank storage. Currently, the commercial occupancy rates at oil tank terminals are very high, and as a result, tank storage rates have increased by 20-30%.

This presents a somewhat unique situation for the tank terminal market. On the one hand, high occupancy rates and increased tank storage rates have a very positive impact on the short-term profitability of oil terminals. However, the consumption of oil products has seen a sharp decline and will takes years to recover fully.

What will this mean for the tank terminal market? At Insights Global, we continuously calibrate our Advanced Tank Terminal Market Model against shifts in the market. Our algorithms take into account macroeconomic trends like oil prices, taxes, trade costs, and interest costs, and (petro)chemical factors like trade flows, logistics, and storage rates. Based on the latest economic developments, we have also incorporated the Corona effect in our forecasting models.

Even though the V-shaped consumption curve (sharp decline followed by a sharp increase) for oil products seems already behind us, we expect it will take five years for consumption levels to normalize fully. Jet-kero consumption is hit especially hard by the Corona-crisis, with an initial reduction of up to 95%. This slow recovery is not only caused by the impending economic recession, but also by the change of habits like working from home and replacing in-person meeting by online meetings.

While the current focus is – understandingly so – on the impact of Covid-19 on the oil market, other essential factors like the electrification of road transport, reverse dieselization of European passenger cars, and IMO 2020 regulation for bunker fuels will also play a key role in the tank terminal market. Naturally, the impact of these events is also incorporated in our Advanced Tank Terminal Market Model.

Having access to accurate, up-to-date oil storage rates is crucial to make the right business decisions.

With our Global Oil Storage Rate Report, you’ll gain access to the single and only authoritative source of storage rate information available worldwide. It will provide you with transparency on price levels in global tank storage markets regularly, so you are always in the know and can set the right ask and bid prices for your storage.

Download your FREE Sample Report now and discover what information you could have at your fingertips each quarter.

What lies in store?

Patrick Kulsen and René Loozen of Insights Global consider the impact of COVID-19 and IMO 2020 on bunker fuel consumption and ARA tank storage demand.

The assumption is that the current lockdown lasts three months and has a negative impact on marine fuel bunker consumption levels. After the lockdown, the consumption level will gradually normalise, which will take five years.

The real impact of COVID on global and regional GDPs is not clear yet, but we may conclude that the IMO 2020 regulation have had a positive impact on the ARA tank storage demand.

As we are now well into the second quarter of 2020 it is useful to look back on the introduction of the recent IMO legislation on the regulation of sulphur emissions from bunker fuels. The dust has settled with respect to the implementation of these new rules. But as this happened a ‘black swan’ arrived on the global oil scene: COVID-19 or the Coronavirus. This pandemic and the international crisis it evoked is gripping international trade and impacting on shipping and bunker sales like nothing we have ever seen before. So, this article will also look forward to estimating the medium-term impact on bunker markets and, in particular, on bunker storage markets.

Run-up to 2020

The International Maritime Organization’s (IMO) regulation mandating a reduction in the sulphur content of marine fuels to 0.50% or below came into effect on 1 January 2020.

Leading up to the start of this new era in marine fuels there were multiple opinions or scenarios about which bunker fuels would become dominant. In first instance, most stakeholders thought high sulphur fuel oil (HSFO) would remain a dominant bunker fuel because of the expected uptake of scrubbers. Other stakeholders assumed that marine gasoil (MGO) would become main bunker fuel as there wouldn’t be enough supply of 0.50% very low sulphur fuel oil (VLSFO). Some oil majors, the International Energy Administration (IEA) and consultants then changed their opinions, believing that VLSFO would become the dominant fuel. There were other stakeholders, like the gasoil traders, who thought that the demand for MGO would increase significantly because of IMO 2020.

The first months of 2020

The first months of 2020 have shown that VLSFO seems to be the dominant bunker fuel. Consumption of MGO increased only slightly by around +10%. HSFO accounts for about 20% of total fuel oil consumption, with the rest being mostly VLSFO.

The introduction of the new VLSFOs has led to some compatibility concerns. VLSFO blends can come from residual components and distillate components. Residual components are mostly aromatic due to the asphaltenes in the bottom of the barrel. Distillates are high on paraffins. Blending these two streams together can lead to compatibility issues. This can occur if a ship switches between different batches and the fuel is mixed in the ship’s fuel tank, a process also known as commingling. The co-mingling of bunker fuels from different origins could lead to serious damage to engines or the clogging of fuel lines. VLSFO residue blends, being more aromatic, and hydrotreated vacuum gasoil (VGO), being less aromatic have these compatibility issues.

These compatibility issues also have an impact on the demand for storage capacity as some product owners have taken steps to avoid commingling new fuels in their tanks. So, this calls for segregated tanks, which will increase demand for tanks.

An important and lucrative business for oil traders in the Amsterdam-Rotterdam-Antwerp (ARA) region used to be the transhipment of fuel oil from Russia to the Far East. However, this transit flow has largely disappeared. On the one hand, the supply of Russian fuel oil has gone down whereas the demand for fuel oil in Asia has also dropped significantly. Furthermore, Asian bunker demand for fuel oil is currently being supplied from other closer regional sources. Nowadays, Russian exports are being directly exported in smaller tankers, with the US as the main destination. The ARA is no longer the heavy fuel oil transhipment hub.

Looking ahead

Our assumption in the post-2020 era is that the shipping industry will keep on using fuel oil as the dominant marine fuel (80%) but it is unclear is what the respective shares of VLSFO and HSFO will be.

In our forecasting models, the Corona effect is incorporated. The assumption is that the current lockdown lasts three months and has a negative impact on marine fuel bunker consumption levels. After the lockdown, the consumption level will gradually normalise, which will take five years. Our assumption of five years is based on experience in the past and the enormous fall of GDP which influences the consumption of fuel oil.
The International Monetary Fund (IMF) forecasts a 3% contraction of global GDP in 2020, while the Eurozone will see a decline of 7.5% in 2020. It will take several years of GDP growth to be back at the same GDP level as in 2019. The consumption of bunker fuel is heavily correlated with global trade, so we expect it will take several years before bunker fuel market is at the same level as in 2019.

Due to growing bunker fuel consumption and declining average production, surplus in NW Europe will change into a deficit. Terminals in ARA specialising in fuel oil will benefit from the growing size of the fuel oil bunker market. As the number of grades has increased and more components are needed to blend into VLSFO / HSFO / MGO, more storage capacity is needed.

Additionally, on top of these structural effects on fuel oil supply, demand and imbalances, there is an enormous oversupply in the market due to the COVID-19 crisis. This has resulted in a steep contango in fuel oil forward prices and is stimulating traders to buy and store excess fuel oil supply. This provides major support for fuel oil storage rates in the short to medium term.

So, in summary, the introduction of the IMO 2020 regulation and the COVID-19 crisis have had the following impact:
• More tanks needed to segregate and blend fuel grades
• Less arbitrage flows limit the demand for large tanks
• Long term bunker demand growth and rising imbalances will support tank demand
• Short to medium term support of fuel oil storage rates due to steep contango.

The real impact of COVID on global and regional GDPs is not clear yet, but we may conclude that the IMO 2020 regulation have had a positive impact on the ARA tank storage demand. Also, in the short to medium term, the COVID-19 / Corona crisis has had a positive effect on the tank terminal business.